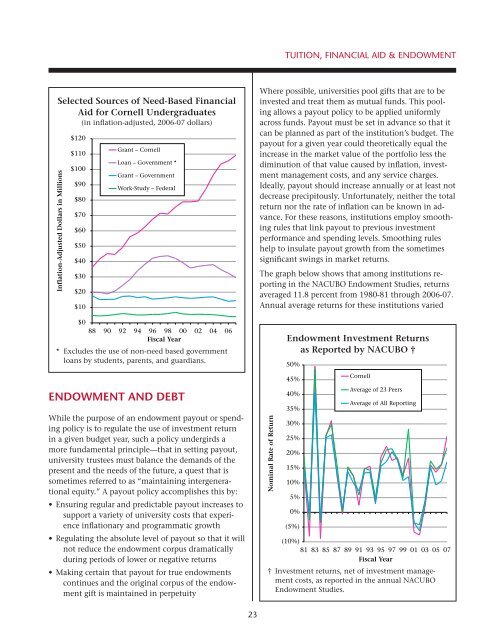
Tuition, <strong>Financial</strong> Aid & Endowmentdeavors, and New York State-funded employee benefitscosts that are related to research.<strong>Financial</strong> AidMost government-funded undergraduate financial-aidprograms were created in the 1960’s, as successors tothe Servicemen’s Readjustment Act <strong>of</strong> 1944, popularlyknown as the “GI Bill.” Pivotal federal legislative actions<strong>of</strong> the time were the Economic Opportunity Act <strong>of</strong>1964 and the Higher Education Act <strong>of</strong> 1965, which isreauthorized periodically. These and other laws createdprograms to provide grant, loan, and work-studysupport for low-income students as well as to channelexpanded funding to higher education institutions directly.As reported by the College Board, 20 the demandfor federal financial-aid funding rose dramatically inthe 1970’s, so much so that the U.S. Congress reshapedthese programs to diminish the cost <strong>of</strong> federalgrant funding, substituting a variety <strong>of</strong> subsidized andunsubsidized loan programs. 21 More recently, Congresshas instituted education tax credits and tuition andfee deductions that benefit middle-income familiesprimarily. 22 These policy changes have: (a) encouragedgenerations <strong>of</strong> students to assume ever increasing levels<strong>of</strong> debt to finance their educations and (b) forcedinstitutions <strong>of</strong> higher education to commit their ownresources to substitute for the missing grant aid. (Seegraph at right.) Federal loan programs currently accountfor 40 percent <strong>of</strong> all student aid, and loans fromall sources represent 52 percent <strong>of</strong> the total. At $26.3billion in 2006-07, grant aid funded by colleges anduniversities from institutional resources exceeded the20 College Board, Trends in Student Aid 2007. http://pr<strong>of</strong>essionals.collegeboard.com/data-reports-research/trends/student-aid-200621 The enrollment <strong>of</strong> first-time freshmen in U.S. degreegrantinginstitutions <strong>of</strong> higher education climbed from670,000 to 1,046,000 over the ten years between 1954-55and 1963-64. This enrollment increased 38 percent in thenext two years, rising to 1,442,000. By 1975-76, the number<strong>of</strong> first-time freshmen had reached 2,515,000—almost twoand a half times the number enrolled when Congress passedthe 1964 and 1965 acts.22 Educational tax benefits were introduced in 1998-99and were projected to total $5.9 billion in 2006-07. In 2005,taxpayers with incomes above $50,000 enjoyed 58 percent<strong>of</strong> all tax education credits and 83 percent <strong>of</strong> all tuition taxdeductions.total <strong>of</strong> federal sources ($19.6 billion) and was slightlyless than the total grant aid provided by federal andstate resources combined ($27.4 billion).Many <strong>of</strong> these national trends have been mirrored at<strong>Cornell</strong> over the past 20 years, though differently andin some cases more dramatically. (See graph at the top<strong>of</strong> page 23.) Federal and state funding for undergraduategrant aid increased nominally but decreased ininflation-adjusted terms, dropping from $17.7 millionin 1987-88 to $14.6 million in 2006-07. The use <strong>of</strong>government loan resources for need-based financialaid (which accounted for 92 percent <strong>of</strong> such loans at<strong>Cornell</strong> in 2006-07) increased in inflation-adjustedterms through the late 1990’s, but has declined since.<strong>Cornell</strong>-funded grant aid has tripled, in inflationadjustedterms, over the same period, rising to $109.3million in 2006-07. <strong>Cornell</strong>’s recently announced initiativeto alter how financial aid is awarded to lowerincomestudents will further transform the trendsdisplayed in this graph by increasing the amount <strong>of</strong><strong>Cornell</strong>-funded grant aid and lowering students’ relianceon federal loan programs.Inflation-Adjusted Dollars in BillionsSelected Sources <strong>of</strong> <strong>Financial</strong> Aid forU.S. Postsecondary Education *(in inflation-adjusted, 2006-07 dollars)$60$50$40$30$20$10Loan – GovernmentGrant – GovernmentGrant – InstitutionalWork-Study – Federal$064 67 70 73 76 79 82 85 88 91 94 97 00 03 06Fiscal Year* Data interpolated between 1964-65 and 1969-70.22
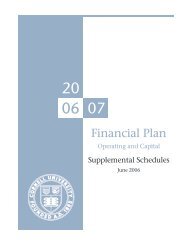
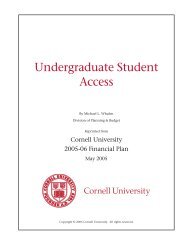
Tuition, <strong>Financial</strong> Aid & EndowmentSelected Sources <strong>of</strong> Need-Based <strong>Financial</strong>Aid for <strong>Cornell</strong> Undergraduates(in inflation-adjusted, 2006-07 dollars)Inflation-Adjusted Dollars in Millions$120$110$100$90$80$70$60$50$40$30$20$10$0Grant – <strong>Cornell</strong>Loan – Government *Grant – GovernmentWork-Study – Federal88 90 92 94 96 98 00 02 04 06Fiscal Year* Excludes the use <strong>of</strong> non-need based governmentloans by students, parents, and guardians.Endowment and DebtWhile the purpose <strong>of</strong> an endowment payout or spendingpolicy is to regulate the use <strong>of</strong> investment returnin a given budget year, such a policy undergirds amore fundamental principle—that in setting payout,university trustees must balance the demands <strong>of</strong> thepresent and the needs <strong>of</strong> the future, a quest that issometimes referred to as “maintaining intergenerationalequity.” A payout policy accomplishes this by:• Ensuring regular and predictable payout increases tosupport a variety <strong>of</strong> university costs that experienceinflationary and programmatic growth• Regulating the absolute level <strong>of</strong> payout so that it willnot reduce the endowment corpus dramaticallyduring periods <strong>of</strong> lower or negative returns• Making certain that payout for true endowmentscontinues and the original corpus <strong>of</strong> the endowmentgift is maintained in perpetuityWhere possible, universities pool gifts that are to beinvested and treat them as mutual funds. This poolingallows a payout policy to be applied uniformlyacross funds. Payout must be set in advance so that itcan be planned as part <strong>of</strong> the institution’s budget. Thepayout for a given year could theoretically equal theincrease in the market value <strong>of</strong> the portfolio less thediminution <strong>of</strong> that value caused by inflation, investmentmanagement costs, and any service charges.Ideally, payout should increase annually or at least notdecrease precipitously. Unfortunately, neither the totalreturn nor the rate <strong>of</strong> inflation can be known in advance.For these reasons, institutions employ smoothingrules that link payout to previous investmentperformance and spending levels. Smoothing ruleshelp to insulate payout growth from the sometimessignificant swings in market returns.The graph below shows that among institutions reportingin the NACUBO Endowment Studies, returnsaveraged 11.8 percent from 1980-81 through 2006-07.Annual average returns for these institutions variedNominal Rate <strong>of</strong> ReturnEndowment Investment Returnsas Reported by NACUBO †50%45%40%35%30%25%20%15%10%5%0%(5%)(10%)<strong>Cornell</strong>Average <strong>of</strong> 23 PeersAverage <strong>of</strong> All Reporting81 83 85 87 89 91 93 95 97 99 01 03 05 07Fiscal Year† Investment returns, net <strong>of</strong> investment managementcosts, as reported in the annual NACUBOEndowment Studies.23
- Page 5 and 6: Operating plan - highlightsIntroduc
- Page 8: Operating plan - highlightsComposit
- Page 11 and 12: Tuition, Financial Aid & Endowmentm
- Page 13 and 14: Tuition, Financial Aid & Endowmentu
- Page 15 and 16: Tuition, Financial Aid & EndowmentC
- Page 17 and 18: Tuition, Financial Aid & Endowmentf
- Page 19 and 20: Tuition, Financial Aid & EndowmentD
- Page 21: Tuition, Financial Aid & EndowmentC
- Page 25 and 26: Tuition, Financial Aid & Endowmentw
- Page 27: Tuition, Financial Aid & Endowmentt
- Page 31 and 32: Tuition, Financial Aid & Endowmentp
- Page 33 and 34: Operating plan - DetailsIthaca Camp
- Page 35 and 36: Operating plan - DetailsSignificant
- Page 37 and 38: Operating plan - Detailstive staff
- Page 39 and 40: Operating plan - Detailsand develop
- Page 41 and 42: Operating plan - DetailsCentrallyOt
- Page 43 and 44: Operating plan - DetailsMedical Col
- Page 45 and 46: Capital PlanDistribution of Space -
- Page 47 and 48: Capital Plan• New York State supp
- Page 49 and 50: Capital PlanFUNDING SOURCESFINANCIN
- Page 51 and 52: Capital PlanEXPENDITURE PATTERNEsti
- Page 53 and 54: Capital PlanFUNDING SOURCESFINANCIN
- Page 55 and 56: Capital PlanEXPENDITURE PATTERNEsti
- Page 57 and 58: Capital PlanEXPENDITURE PATTERNEsti
- Page 59 and 60: Capital PlanDebt Service by Operati
- Page 61 and 62: BStudent Fees and Other Tuition Rat
- Page 63 and 64: DUndergraduate Tuition, Fees, Room,
- Page 65 and 66: FAverage Nine-Month Faculty Salarie
- Page 67 and 68: HNew York State AppropriationsSourc
- Page 69 and 70: JInvestment Assets, Returns, and Pa
- Page 71 and 72: LGifts/Contributions - Through Marc
- Page 73 and 74:
NWorkforce - Ithaca Campus2007-08 I
- Page 75 and 76:
PU.S. Senate ResponseThe Senate Com
- Page 77 and 78:
U.S. Senate Response (continued)of
- Page 79 and 80:
U.S. Senate Response (continued)inc
- Page 81 and 82:
U.S. Senate Response (continued)fro
- Page 83 and 84:
U.S. Senate Response (continued)Tab
- Page 85 and 86:
U.S. Senate Response (continued)Tab
- Page 87 and 88:
U.S. Senate Response (continued)Tab