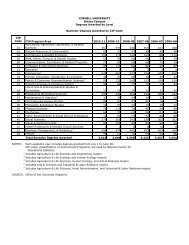
U.S. Senate Response (continued)categories include the PBIF ($609,353,000), the SeparatelyInvested Portfolio ($478,902,000), Pooled Life IncomeFunds ($16,935,000), and other miscellaneous categories($62,725,000). These amounts are shown at fair value as <strong>of</strong>June 30, 2007.8) What has been the cost <strong>of</strong> management <strong>of</strong> the endowmentyear-by-year for the last ten years?Response:The costs <strong>of</strong> managing the LTIP are shown in Table 13(below). These include external management fees as well as<strong>Cornell</strong>’s internal management costs, including its investment<strong>of</strong>fice as well as investment accounting and oversightfunctions. Table 13 also shows the annual totals <strong>of</strong> these costsas a percent <strong>of</strong> the LTIP’s market value for the beginning <strong>of</strong>the fiscal year in which the costs were incurred. In some cases,external investment managers incurred costs that were nettedfrom the investment proceeds delivered to the university.9a) What was the payout (both in dollars and percentage)from the endowment year-by-year for the last ten years?Response:The average payout for the period 1997-98 through 2006-07was 5.1%. At <strong>Cornell</strong>, the total LTIP payout consists <strong>of</strong>the monies released during the fiscal year to support theprogrammatic costs <strong>of</strong> an individual endowment’s purposeand a distribution for the attendant general and stewardshipsupport <strong>of</strong> these activities. The investment management costsitemized in Table 13 (below) and excluded in Table 14 (atthe top <strong>of</strong> page 85) are separate from this total payout. Forpurposes <strong>of</strong> answering this question, total payout as a percent<strong>of</strong> market value is shown for the beginning <strong>of</strong> the fiscal year inwhich the total payout was applied, in keeping with the 2007NACUBO convention on the reporting <strong>of</strong> spending rates:As a guideline, the calculated spending rate is the percentage <strong>of</strong>the beginning market value <strong>of</strong> the investment pool that is madeavailable annually for spending. The rate is calculated net <strong>of</strong> anyexpenses for managing and administering the endowment.9b) What is the targeted payout (in percentage) from theendowment year-by-year for the last ten years?Response:The average targeted payout for the period 1997-98 through2006-07 was 5.1%. The trustee policy on distributions fromthe LTIP targets total payout at 4.86% (4.4% programmaticpayout plus 0.46 % payout for the general and stewardshipcosts <strong>of</strong> the programs supported by the LTIP) <strong>of</strong> a twelvequarterrolling average <strong>of</strong> unit share values ± 75 basis points.A total payout rate for a coming year could be as low as4.11% <strong>of</strong> that rolling average or as high as 5.61% and remainwithin trustee policy guidelines.The Board <strong>of</strong> Trustees establishes a payout rate (target) for acoming fiscal year five months in advance <strong>of</strong> the start <strong>of</strong> thatfiscal year. The trustees measure that payout against a largelyretrospective rolling average <strong>of</strong> market values in order tosmooth out the fluctuations <strong>of</strong> investment factors that cangreatly vary the LTIP’s market valuations. Table 15 (at thebottom <strong>of</strong> page 85) lists those targeted payout amounts pershare, the increase in the payout amount per share from theprior year, the twelve-quarter rolling average <strong>of</strong> unit sharevalues through the end <strong>of</strong> the prior fiscal year, and the percentTable 13. LTIP Investment Management CostsTotalManagementExternal Internal Total Costs as a %Management Management Management <strong>of</strong> BeginningYear Fees Costs Costs Market Value1997-98 $7,146,000 $1,328,000 $8,474,000 0.4%1998-99 6,513,000 1,809,000 8,322,000 0.3%1999-00 6,691,000 2,210,000 8,901,000 0.3%2000-01 6,827,000 2,225,000 9,052,000 0.3%2001-02 5,910,000 2,141,000 8,051,000 0.3%2002-03 5,098,000 2,678,000 7,776,000 0.3%2003-04 5,794,000 3,435,000 9,229,000 0.3%2004-05 8,247,000 4,079,000 12,326,000 0.4%2005-06 10,503,000 4,870,000 15,373,000 0.4%* 2006-07 10,884,000 6,456,000 17,340,000 0.4%* Beginning in 2006-07, <strong>Cornell</strong>’s Board <strong>of</strong> Trustees significantly restructured the university’s Investment Office, increasing the number <strong>of</strong> staffand the quality <strong>of</strong> oversight <strong>of</strong> external investment managers and partners. The Board <strong>of</strong> Trustees also imposed a cap on internal investmentcosts vis-à-vis the investment portfolio, and actively manages against this limit.84
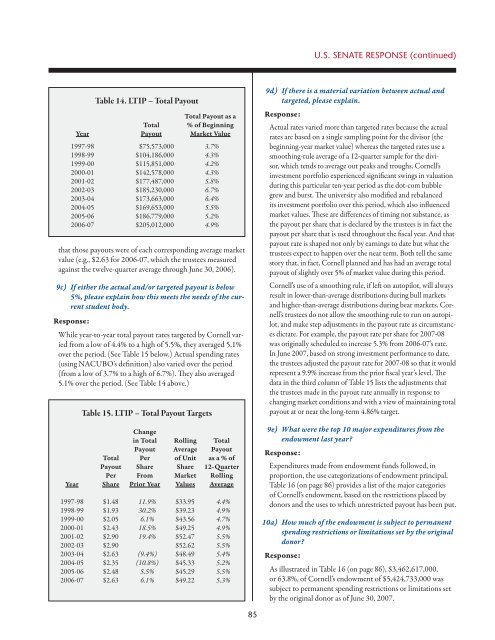
U.S. Senate Response (continued)Table 14. LTIP – Total PayoutTotal Payout as aTotal % <strong>of</strong> BeginningYear Payout Market Value1997-98 $75,573,000 3.7%1998-99 $104,186,000 4.3%1999-00 $115,851,000 4.2%2000-01 $142,578,000 4.3%2001-02 $177,487,000 5.8%2002-03 $185,230,000 6.7%2003-04 $173,663,000 6.4%2004-05 $169,653,000 5.5%2005-06 $186,779,000 5.2%2006-07 $205,012,000 4.9%that those payouts were <strong>of</strong> each corresponding average marketvalue (e.g., $2.63 for 2006-07, which the trustees measuredagainst the twelve-quarter average through June 30, 2006).9c) If either the actual and/or targeted payout is below5%, please explain how this meets the needs <strong>of</strong> the currentstudent body.Response:While year-to-year total payout rates targeted by <strong>Cornell</strong> variedfrom a low <strong>of</strong> 4.4% to a high <strong>of</strong> 5.5%, they averaged 5.1%over the period. (See Table 15 below.) Actual spending rates(using NACUBO’s definition) also varied over the period(from a low <strong>of</strong> 3.7% to a high <strong>of</strong> 6.7%). They also averaged5.1% over the period. (See Table 14 above.)Table 15. LTIP – Total Payout TargetsChangein Total Rolling TotalPayout Average PayoutTotal Per <strong>of</strong> Unit as a % <strong>of</strong>Payout Share Share 12-QuarterPer From Market RollingYear Share Prior Year Values Average1997-98 $1.48 11.9% $33.95 4.4%1998-99 $1.93 30.2% $39.23 4.9%1999-00 $2.05 6.1% $43.56 4.7%2000-01 $2.43 18.5% $49.25 4.9%2001-02 $2.90 19.4% $52.47 5.5%2002-03 $2.90 $52.62 5.5%2003-04 $2.63 (9.4%) $48.49 5.4%2004-05 $2.35 (10.8%) $45.33 5.2%2005-06 $2.48 5.5% $45.29 5.5%2006-07 $2.63 6.1% $49.22 5.3%9d) If there is a material variation between actual andtargeted, please explain.Response:Actual rates varied more than targeted rates because the actualrates are based on a single sampling point for the divisor (thebeginning-year market value) whereas the targeted rates use asmoothing-rule average <strong>of</strong> a 12-quarter sample for the divisor,which tends to average out peaks and troughs. <strong>Cornell</strong>’sinvestment portfolio experienced significant swings in valuationduring this particular ten-year period as the dot-com bubblegrew and burst. The university also modified and rebalancedits investment portfolio over this period, which also influencedmarket values. These are differences <strong>of</strong> timing not substance, asthe payout per share that is declared by the trustees is in fact thepayout per share that is used throughout the fiscal year. And thatpayout rate is shaped not only by earnings to date but what thetrustees expect to happen over the near term. Both tell the samestory that, in fact, <strong>Cornell</strong> planned and has had an average totalpayout <strong>of</strong> slightly over 5% <strong>of</strong> market value during this period.<strong>Cornell</strong>’s use <strong>of</strong> a smoothing rule, if left on autopilot, will alwaysresult in lower-than-average distributions during bull marketsand higher-than-average distributions during bear markets. <strong>Cornell</strong>’strustees do not allow the smoothing rule to run on autopilot,and make step adjustments in the payout rate as circumstancesdictate. For example, the payout rate per share for 2007-08was originally scheduled to increase 5.3% from 2006-07’s rate.In June 2007, based on strong investment performance to date,the trustees adjusted the payout rate for 2007-08 so that it wouldrepresent a 9.9% increase from the prior fiscal year’s level. Thedata in the third column <strong>of</strong> Table 15 lists the adjustments thatthe trustees made in the payout rate annually in response tochanging market conditions and with a view <strong>of</strong> maintaining totalpayout at or near the long-term 4.86% target.9e) What were the top 10 major expenditures from theendowment last year?Response:Expenditures made from endowment funds followed, inproportion, the use categorizations <strong>of</strong> endowment principal.Table 16 (on page 86) provides a list <strong>of</strong> the major categories<strong>of</strong> <strong>Cornell</strong>’s endowment, based on the restrictions placed bydonors and the uses to which unrestricted payout has been put.10a) How much <strong>of</strong> the endowment is subject to permanentspending restrictions or limitations set by the originaldonor?Response:As illustrated in Table 16 (on page 86), $3,462,617,000,or 63.8%, <strong>of</strong> <strong>Cornell</strong>’s endowment <strong>of</strong> $5,424,733,000 wassubject to permanent spending restrictions or limitations setby the original donor as <strong>of</strong> June 30, 2007.85
- Page 5 and 6:
Operating plan - highlightsIntroduc
- Page 8:
Operating plan - highlightsComposit
- Page 11 and 12:
Tuition, Financial Aid & Endowmentm
- Page 13 and 14:
Tuition, Financial Aid & Endowmentu
- Page 15 and 16:
Tuition, Financial Aid & EndowmentC
- Page 17 and 18:
Tuition, Financial Aid & Endowmentf
- Page 19 and 20:
Tuition, Financial Aid & EndowmentD
- Page 21 and 22:
Tuition, Financial Aid & EndowmentC
- Page 23 and 24:
Tuition, Financial Aid & EndowmentS
- Page 25 and 26:
Tuition, Financial Aid & Endowmentw
- Page 27:
Tuition, Financial Aid & Endowmentt
- Page 31 and 32:
Tuition, Financial Aid & Endowmentp
- Page 33 and 34: Operating plan - DetailsIthaca Camp
- Page 35 and 36: Operating plan - DetailsSignificant
- Page 37 and 38: Operating plan - Detailstive staff
- Page 39 and 40: Operating plan - Detailsand develop
- Page 41 and 42: Operating plan - DetailsCentrallyOt
- Page 43 and 44: Operating plan - DetailsMedical Col
- Page 45 and 46: Capital PlanDistribution of Space -
- Page 47 and 48: Capital Plan• New York State supp
- Page 49 and 50: Capital PlanFUNDING SOURCESFINANCIN
- Page 51 and 52: Capital PlanEXPENDITURE PATTERNEsti
- Page 53 and 54: Capital PlanFUNDING SOURCESFINANCIN
- Page 55 and 56: Capital PlanEXPENDITURE PATTERNEsti
- Page 57 and 58: Capital PlanEXPENDITURE PATTERNEsti
- Page 59 and 60: Capital PlanDebt Service by Operati
- Page 61 and 62: BStudent Fees and Other Tuition Rat
- Page 63 and 64: DUndergraduate Tuition, Fees, Room,
- Page 65 and 66: FAverage Nine-Month Faculty Salarie
- Page 67 and 68: HNew York State AppropriationsSourc
- Page 69 and 70: JInvestment Assets, Returns, and Pa
- Page 71 and 72: LGifts/Contributions - Through Marc
- Page 73 and 74: NWorkforce - Ithaca Campus2007-08 I
- Page 75 and 76: PU.S. Senate ResponseThe Senate Com
- Page 77 and 78: U.S. Senate Response (continued)of
- Page 79 and 80: U.S. Senate Response (continued)inc
- Page 81 and 82: U.S. Senate Response (continued)fro
- Page 83: U.S. Senate Response (continued)Tab
- Page 87 and 88: U.S. Senate Response (continued)Tab