Financial Plan - Cornell University Division of Budget & Planning
Financial Plan - Cornell University Division of Budget & Planning
Financial Plan - Cornell University Division of Budget & Planning

Create successful ePaper yourself
Turn your PDF publications into a flip-book with our unique Google optimized e-Paper software.
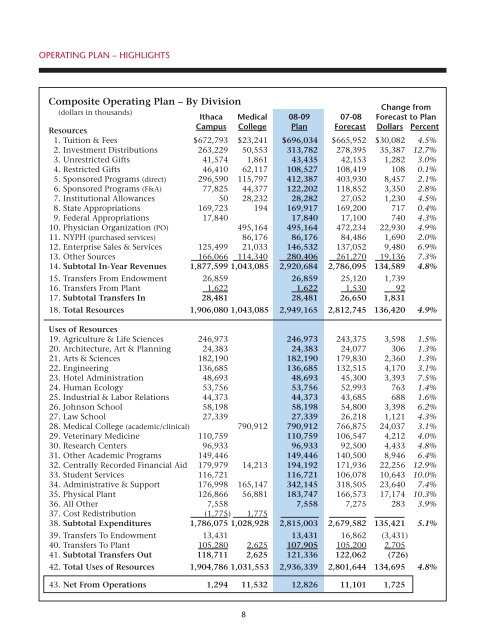
Operating plan – highlightsComposite Operating <strong>Plan</strong> – By <strong>Division</strong>Change from(dollars in thousands)Ithaca Medical 08-09 07-08 Forecast to <strong>Plan</strong>ResourcesCampus College <strong>Plan</strong> Forecast Dollars Percent1. Tuition & Fees $672,793 $23,241 $696,034 $665,952 $30,082 4.5%2. Investment Distributions 263,229 50,553 313,782 278,395 35,387 12.7%3. Unrestricted Gifts 41,574 1,861 43,435 42,153 1,282 3.0%4. Restricted Gifts 46,410 62,117 108,527 108,419 108 0.1%5. Sponsored Programs (direct) 296,590 115,797 412,387 403,930 8,457 2.1%6. Sponsored Programs (F&A) 77,825 44,377 122,202 118,852 3,350 2.8%7. Institutional Allowances 50 28,232 28,282 27,052 1,230 4.5%8. State Appropriations 169,723 194 169,917 169,200 717 0.4%9. Federal Appropriations 17,840 17,840 17,100 740 4.3%10. Physician Organization (PO) 495,164 495,164 472,234 22,930 4.9%11. NYPH (purchased services) 86,176 86,176 84,486 1,690 2.0%12. Enterprise Sales & Services 125,499 21,033 146,532 137,052 9,480 6.9%13. Other Sources 166,066 114,340 280,406 261,270 19,136 7.3%14. Subtotal In-Year Revenues 1,877,599 1,043,085 2,920,684 2,786,095 134,589 4.8%15. Transfers From Endowment 26,859 26,859 25,120 1,73916. Transfers From <strong>Plan</strong>t 1,622 1,622 1,530 9217. Subtotal Transfers In 28,481 28,481 26,650 1,83118. Total Resources 1,906,080 1,043,085 2,949,165 2,812,745 136,420 4.9%Uses <strong>of</strong> Resources19. Agriculture & Life Sciences 246,973 246,973 243,375 3,598 1.5%20. Architecture, Art & <strong>Plan</strong>ning 24,383 24,383 24,077 306 1.3%21. Arts & Sciences 182,190 182,190 179,830 2,360 1.3%22. Engineering 136,685 136,685 132,515 4,170 3.1%23. Hotel Administration 48,693 48,693 45,300 3,393 7.5%24. Human Ecology 53,756 53,756 52,993 763 1.4%25. Industrial & Labor Relations 44,373 44,373 43,685 688 1.6%26. Johnson School 58,198 58,198 54,800 3,398 6.2%27. Law School 27,339 27,339 26,218 1,121 4.3%28. Medical College (academic/clinical) 790,912 790,912 766,875 24,037 3.1%29. Veterinary Medicine 110,759 110,759 106,547 4,212 4.0%30. Research Centers 96,933 96,933 92,500 4,433 4.8%31. Other Academic Programs 149,446 149,446 140,500 8,946 6.4%32. Centrally Recorded <strong>Financial</strong> Aid 179,979 14,213 194,192 171,936 22,256 12.9%33. Student Services 116,721 116,721 106,078 10,643 10.0%34. Administrative & Support 176,998 165,147 342,145 318,505 23,640 7.4%35. Physical <strong>Plan</strong>t 126,866 56,881 183,747 166,573 17,174 10.3%36. All Other 7,558 7,558 7,275 283 3.9%37. Cost Redistribution (1,775) 1,77538. Subtotal Expenditures 1,786,075 1,028,928 2,815,003 2,679,582 135,421 5.1%39. Transfers To Endowment 13,431 13,431 16,862 (3,431)40. Transfers To <strong>Plan</strong>t 105,280 2,625 107,905 105,200 2,70541. Subtotal Transfers Out 118,711 2,625 121,336 122,062 (726)42. Total Uses <strong>of</strong> Resources 1,904,786 1,031,553 2,936,339 2,801,644 134,695 4.8%43. Net From Operations 1,294 11,532 12,826 11,101 1,7258