Financial Plan - Cornell University Division of Budget & Planning
Financial Plan - Cornell University Division of Budget & Planning
Financial Plan - Cornell University Division of Budget & Planning

You also want an ePaper? Increase the reach of your titles
YUMPU automatically turns print PDFs into web optimized ePapers that Google loves.
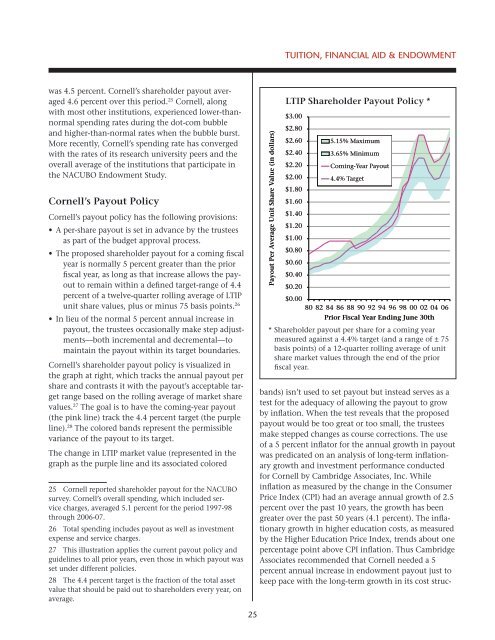
Tuition, <strong>Financial</strong> Aid & Endowmentwas 4.5 percent. <strong>Cornell</strong>’s shareholder payout averaged4.6 percent over this period. 25 <strong>Cornell</strong>, alongwith most other institutions, experienced lower-thannormalspending rates during the dot-com bubbleand higher-than-normal rates when the bubble burst.More recently, <strong>Cornell</strong>’s spending rate has convergedwith the rates <strong>of</strong> its research university peers and theoverall average <strong>of</strong> the institutions that participate inthe NACUBO Endowment Study.<strong>Cornell</strong>’s Payout Policy<strong>Cornell</strong>’s payout policy has the following provisions:• A per-share payout is set in advance by the trusteesas part <strong>of</strong> the budget approval process.• The proposed shareholder payout for a coming fiscalyear is normally 5 percent greater than the priorfiscal year, as long as that increase allows the payoutto remain within a defined target-range <strong>of</strong> 4.4percent <strong>of</strong> a twelve-quarter rolling average <strong>of</strong> LTIPunit share values, plus or minus 75 basis points. 26• In lieu <strong>of</strong> the normal 5 percent annual increase inpayout, the trustees occasionally make step adjustments—bothincremental and decremental—tomaintain the payout within its target boundaries.<strong>Cornell</strong>’s shareholder payout policy is visualized inthe graph at right, which tracks the annual payout pershare and contrasts it with the payout’s acceptable targetrange based on the rolling average <strong>of</strong> market sharevalues. 27 The goal is to have the coming-year payout(the pink line) track the 4.4 percent target (the purpleline). 28 The colored bands represent the permissiblevariance <strong>of</strong> the payout to its target.The change in LTIP market value (represented in thegraph as the purple line and its associated colored25 <strong>Cornell</strong> reported shareholder payout for the NACUBOsurvey. <strong>Cornell</strong>’s overall spending, which included servicecharges, averaged 5.1 percent for the period 1997-98through 2006-07.26 Total spending includes payout as well as investmentexpense and service charges.27 This illustration applies the current payout policy andguidelines to all prior years, even those in which payout wasset under different policies.28 The 4.4 percent target is the fraction <strong>of</strong> the total assetvalue that should be paid out to shareholders every year, onaverage.Payout Per Average Unit Share Value (in dollars)LTIP Shareholder Payout Policy *$3.00$2.80$2.60$2.40$2.20$2.00$1.80$1.60$1.40$1.20$1.00$0.80$0.60$0.40$0.205.15% Maximum3.65% MinimumComing-Year Payout4.4% Target$0.0080 82 84 86 88 90 92 94 96 98 00 02 04 06Prior Fiscal Year Ending June 30th* Shareholder payout per share for a coming yearmeasured against a 4.4% target (and a range <strong>of</strong> ± 75basis points) <strong>of</strong> a 12-quarter rolling average <strong>of</strong> unitshare market values through the end <strong>of</strong> the priorfiscal year.bands) isn’t used to set payout but instead serves as atest for the adequacy <strong>of</strong> allowing the payout to growby inflation. When the test reveals that the proposedpayout would be too great or too small, the trusteesmake stepped changes as course corrections. The use<strong>of</strong> a 5 percent inflator for the annual growth in payoutwas predicated on an analysis <strong>of</strong> long-term inflationarygrowth and investment performance conductedfor <strong>Cornell</strong> by Cambridge Associates, Inc. Whileinflation as measured by the change in the ConsumerPrice Index (CPI) had an average annual growth <strong>of</strong> 2.5percent over the past 10 years, the growth has beengreater over the past 50 years (4.1 percent). The inflationarygrowth in higher education costs, as measuredby the Higher Education Price Index, trends about onepercentage point above CPI inflation. Thus CambridgeAssociates recommended that <strong>Cornell</strong> needed a 5percent annual increase in endowment payout just tokeep pace with the long-term growth in its cost struc-25