U.S. Senate Response (continued)Table 16. Endowment Principle Categorized by Use( June 30, 2007 market value)% <strong>of</strong>Category Unrestricted Restricted Total TotalAcademic Programs $568,540,000 $1,143,509,000 $1,712,049,000 31.6%Student Aid * 200,929,000 1,070,694,000 1,271,623,000 23.4%Position Support † 351,793,000 551,812,000 903,605,000 16.7%General Purpose 593,466,000 593,466,000 10.9%Facilities 38,108,000 87,981,000 126,089,000 2.3%Student Services 16,155,000 98,304,000 114,459,000 2.1%Libraries 9,897,000 54,949,000 64,846,000 1.2%Public Service 15,209,000 23,702,000 38,911,000 0.7%Institutional Support 31,226,000 5,113,000 36,339,000 0.7%Miscellaneous Categories 136,793,000 113,104,000 249,897,000 4.6%Subtotal Categorized 1,962,116,000 3,149,168,000 5,111,284,000 94.2%Outside Trusts, etc. § 313,449,000 313,449,000 5.8%Total 1,962,116,000 3,462,617,000 5,424,733,000 100.0%% <strong>of</strong> Total 36.2% 63.8%* “Student Aid” includes undergraduate, graduate, and pr<strong>of</strong>essional student populations and encompasses support for grant aid, loans, andwork/study opportunities as well as graduate fellowships and tuition remission programs.† “Position Support” is composed primarily <strong>of</strong> endowed pr<strong>of</strong>essorships designed to support faculty positions.§ “Outside Trusts, etc.” includes restricted outside trusts, pledges, and bequests where the specific purpose <strong>of</strong> restriction is not available.10b) Of the portion subject to permanent limitations, whatpercentage is restricted for need-based scholarships?Response:Of the $3,462,617,000 <strong>of</strong> endowment assets subject topermanent spending restrictions or limitations (as reportedabove in Table 16), $1,070,694,000 is categorized as “studentaid.” Student aid includes undergraduate, graduate, andpr<strong>of</strong>essional student populations and encompasses supportfor grant aid, loans, and work/study opportunities as well asgraduate fellowships and tuition remission programs. A total<strong>of</strong> $981,680,000, or 28.4% <strong>of</strong> the $3,462,617,000 is furtherlimited to grant aid as opposed to student loans and studentprizes. (Student prizes are small, non-need-based awards thatare given primarily at graduation to recognize exemplaryacademic achievement.)All undergraduate financial aid at <strong>Cornell</strong> is need-based.Graduate and pr<strong>of</strong>essional student financial aid is awardedbased on financial need and merit (although the bulk <strong>of</strong> itis need-based). The “grant aid” category represented by the$981,680,000 figure is not pure, however, as some endowmentsso characterized can be used for both grants and loans(and in some cases, variably from year to year). Also, in accordancewith the terms <strong>of</strong> individual gift agreements, someendowments can be used to support both undergraduate andgraduate/pr<strong>of</strong>essional students, and the proportion <strong>of</strong> suchaid can vary among these populations annually.10c) What portion is restricted for undergraduate financialaid?Response:Of the $3,462,617,000 <strong>of</strong> endowment assets subject to permanentspending restrictions or limitations (as reported abovein Table 16), endowments totaling $750,332,000, or 21.7%,provided payout to support undergraduate financial aid (grantaid, loans, and work/study opportunities). As noted abovein the answer to question 10b, the payout from some <strong>of</strong> thisendowment principal may have provided support for graduateand pr<strong>of</strong>essional students as well in 2006-07.10d) Please provide the top five types <strong>of</strong> restrictions on theendowment by category.Response:Table 17 (at the top <strong>of</strong> page 87) provides a list <strong>of</strong> the five majortypes <strong>of</strong> endowment restrictions by market value <strong>of</strong> category.10e) What percentage <strong>of</strong> the endowment is subject tosignificant limitations placed on it due to a decisionby the board (or a subcommittee <strong>of</strong> the board) or acollege or university <strong>of</strong>ficial—such as a set-aside for aspecific program?Response:As can be seen in Table 16 (above), 36.2% <strong>of</strong> <strong>Cornell</strong>’s totalendowment is unrestricted. Of the total unrestricted amount,86
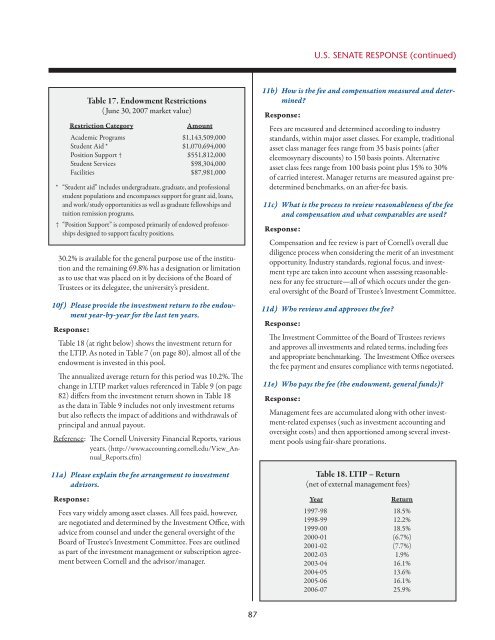
U.S. Senate Response (continued)Table 17. Endowment Restrictions( June 30, 2007 market value)Restriction CategoryAmountAcademic Programs $1,143,509,000Student Aid * $1,070,694,000Position Support † $551,812,000Student Services $98,304,000Facilities $87,981,000* “Student aid” includes undergraduate, graduate, and pr<strong>of</strong>essionalstudent populations and encompasses support for grant aid, loans,and work/study opportunities as well as graduate fellowships andtuition remission programs.† “Position Support” is composed primarily <strong>of</strong> endowed pr<strong>of</strong>essorshipsdesigned to support faculty positions.30.2% is available for the general purpose use <strong>of</strong> the institutionand the remaining 69.8% has a designation or limitationas to use that was placed on it by decisions <strong>of</strong> the Board <strong>of</strong>Trustees or its delegatee, the university’s president.10f ) Please provide the investment return to the endowmentyear-by-year for the last ten years.Response:Table 18 (at right below) shows the investment return forthe LTIP. As noted in Table 7 (on page 80), almost all <strong>of</strong> theendowment is invested in this pool.The annualized average return for this period was 10.2%. Thechange in LTIP market values referenced in Table 9 (on page82) differs from the investment return shown in Table 18as the data in Table 9 includes not only investment returnsbut also reflects the impact <strong>of</strong> additions and withdrawals <strong>of</strong>principal and annual payout.Reference: The <strong>Cornell</strong> <strong>University</strong> <strong>Financial</strong> Reports, variousyears. (http://www.accounting.cornell.edu/View_Annual_Reports.cfm)11a) Please explain the fee arrangement to investmentadvisors.Response:Fees vary widely among asset classes. All fees paid, however,are negotiated and determined by the Investment Office, withadvice from counsel and under the general oversight <strong>of</strong> theBoard <strong>of</strong> Trustee’s Investment Committee. Fees are outlinedas part <strong>of</strong> the investment management or subscription agreementbetween <strong>Cornell</strong> and the advisor/manager.11b) How is the fee and compensation measured and determined?Response:Fees are measured and determined according to industrystandards, within major asset classes. For example, traditionalasset class manager fees range from 35 basis points (aftereleemosynary discounts) to 150 basis points. Alternativeasset class fees range from 100 basis point plus 15% to 30%<strong>of</strong> carried interest. Manager returns are measured against predeterminedbenchmarks, on an after-fee basis.11c) What is the process to review reasonableness <strong>of</strong> the feeand compensation and what comparables are used?Response:Compensation and fee review is part <strong>of</strong> <strong>Cornell</strong>’s overall duediligence process when considering the merit <strong>of</strong> an investmentopportunity. Industry standards, regional focus, and investmenttype are taken into account when assessing reasonablenessfor any fee structure—all <strong>of</strong> which occurs under the generaloversight <strong>of</strong> the Board <strong>of</strong> Trustee’s Investment Committee.11d) Who reviews and approves the fee?Response:The Investment Committee <strong>of</strong> the Board <strong>of</strong> Trustees reviewsand approves all investments and related terms, including feesand appropriate benchmarking. The Investment Office overseesthe fee payment and ensures compliance with terms negotiated.11e) Who pays the fee (the endowment, general funds)?Response:Management fees are accumulated along with other investment-relatedexpenses (such as investment accounting andoversight costs) and then apportioned among several investmentpools using fair-share prorations.Table 18. LTIP – Return(net <strong>of</strong> external management fees)YearReturn1997-98 18.5%1998-99 12.2%1999-00 18.5%2000-01 (6.7%)2001-02 (7.7%)2002-03 1.9%2003-04 16.1%2004-05 13.6%2005-06 16.1%2006-07 25.9%87
- Page 5 and 6:
Operating plan - highlightsIntroduc
- Page 8:
Operating plan - highlightsComposit
- Page 11 and 12:
Tuition, Financial Aid & Endowmentm
- Page 13 and 14:
Tuition, Financial Aid & Endowmentu
- Page 15 and 16:
Tuition, Financial Aid & EndowmentC
- Page 17 and 18:
Tuition, Financial Aid & Endowmentf
- Page 19 and 20:
Tuition, Financial Aid & EndowmentD
- Page 21 and 22:
Tuition, Financial Aid & EndowmentC
- Page 23 and 24:
Tuition, Financial Aid & EndowmentS
- Page 25 and 26:
Tuition, Financial Aid & Endowmentw
- Page 27:
Tuition, Financial Aid & Endowmentt
- Page 31 and 32:
Tuition, Financial Aid & Endowmentp
- Page 33 and 34:
Operating plan - DetailsIthaca Camp
- Page 35 and 36: Operating plan - DetailsSignificant
- Page 37 and 38: Operating plan - Detailstive staff
- Page 39 and 40: Operating plan - Detailsand develop
- Page 41 and 42: Operating plan - DetailsCentrallyOt
- Page 43 and 44: Operating plan - DetailsMedical Col
- Page 45 and 46: Capital PlanDistribution of Space -
- Page 47 and 48: Capital Plan• New York State supp
- Page 49 and 50: Capital PlanFUNDING SOURCESFINANCIN
- Page 51 and 52: Capital PlanEXPENDITURE PATTERNEsti
- Page 53 and 54: Capital PlanFUNDING SOURCESFINANCIN
- Page 55 and 56: Capital PlanEXPENDITURE PATTERNEsti
- Page 57 and 58: Capital PlanEXPENDITURE PATTERNEsti
- Page 59 and 60: Capital PlanDebt Service by Operati
- Page 61 and 62: BStudent Fees and Other Tuition Rat
- Page 63 and 64: DUndergraduate Tuition, Fees, Room,
- Page 65 and 66: FAverage Nine-Month Faculty Salarie
- Page 67 and 68: HNew York State AppropriationsSourc
- Page 69 and 70: JInvestment Assets, Returns, and Pa
- Page 71 and 72: LGifts/Contributions - Through Marc
- Page 73 and 74: NWorkforce - Ithaca Campus2007-08 I
- Page 75 and 76: PU.S. Senate ResponseThe Senate Com
- Page 77 and 78: U.S. Senate Response (continued)of
- Page 79 and 80: U.S. Senate Response (continued)inc
- Page 81 and 82: U.S. Senate Response (continued)fro
- Page 83 and 84: U.S. Senate Response (continued)Tab
- Page 85: U.S. Senate Response (continued)Tab