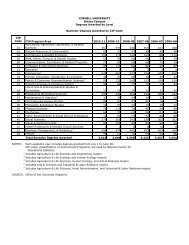
CEnrollment AssumptionsFall 07 08-09 Fall 08 08-09 ProjectedActual Overall Projected Full-Time Equivalent (FTE)Registrar Enrollment Registrar Tuition-Paying Enrollments *Enrollments Targets Enrollments Resident Nonres. TotalUndergraduate – On-Campus1. Agriculture & Life Sciences 3,166 3,057 3,134 1,771 1,296 3,0672. Architecture, Art & <strong>Plan</strong>ning 459 444 460 444 4443. Arts & Sciences 3,995 3,929 4,037 3,932 3,9324. Engineering 2,729 2,701 2,723 2,722 2,7225. Hotel Administration 857 825 848 820 8206. Human Ecology 1,204 1,186 1,213 669 509 1,1787. Industrial & Labor Relations 802 784 814 407 384 7918. Internal Transfer <strong>Division</strong> 38 49 40 49 499. Subtotal On-Campus 13,250 12,975 13,269 10,814 2,189 13,003Undergraduate – Off-Campus †10. <strong>Cornell</strong> Abroad 126 275 160 275 27511. <strong>Cornell</strong>-in-Washington 31 39 39 39 3912. Field Study/Other Programs 102 110 103 110 11013. Rome Program 34 53 55 53 5314. New York City Program 13 13 15 13 1315. Subtotal Off-Campus 306 490 372 490 49016. Total Undergraduate 13,556 13,465 13,641 11,304 2,189 13,493Pr<strong>of</strong>essional17. Johnson School (MBA) 867 908 918 868 86818. Law School (JD) 578 560 560 560 56019. Medical College (MD) 394 410 410 410 41020. Veterinary Medicine (DVM) 336 335 335 200 135 33521. Total Pr<strong>of</strong>essional 2,175 2,213 2,223 2,038 135 2,173Graduate22. Agriculture & Life Sciences 905 935 935 935 93523. Architecture, Art & <strong>Plan</strong>ning § 403 400 403 400 40024. Arts & Sciences 1,225 1,255 1,255 1,255 1,25525. Engineering 1,288 1,270 1,284 1,270 1,27026. Hotel Administration 65 69 69 69 6927. Human Ecology 187 184 184 184 18428. Industrial & Labor Relations 183 180 180 180 18029. Johnson School 47 40 40 40 4030. Law School 75 66 66 66 6631. Graduate School <strong>of</strong> Medical Sciences 310 381 381 381 38132. Veterinary Medicine 142 140 140 140 14033. Total Graduate 4,830 4,920 4,937 4,920 4,92034. Total Enrollment 20,561 20,598 20,801 20,586Notes:* Tuition revenues are based on FTE enrollments, which account for fall-to-spring enrollment differences,tuition prorations for students attending less than a full semester, and Johnson School enrollees in theQueens EMBA program who pay tuition to Queens <strong>University</strong> rather than <strong>Cornell</strong> <strong>University</strong>.† The difference between fall registrar and FTE paying enrollments for <strong>of</strong>f-campus programs reflectshigher enrollments in these programs during the spring semester, especially in <strong>Cornell</strong> Abroad.§ All <strong>Cornell</strong> Institute for Public Affairs enrollments have been consolidated on line 23 in this schedule.62
DUndergraduate Tuition, Fees, Room, and BoardIvy League, Peer, and Common Acceptance InstitutionsTuition & Mandatory FeesInstitution 06-07 07-08 %Tuition, Fees, Room & BoardInstitution 06-07 07-08 %Carnegie Mellon $34,578 $37,354 8.0 Georgetown $45,676 $48,286 5.7Columbia 35,166 37,223 5.8 NYU 45,200 47,490 5.1Tufts 34,730 36,700 5.7 Columbia 44,814 47,160 5.2Brown 34,620 36,342 5.0 Carnegie Mellon 43,858 47,014 7.2U. Pennsylvania 34,408 36,242 5.3 Chicago 44,613 47,007 5.4Georgetown 34,110 36,140 6.0 Johns Hopkins 45,022 46,992 4.4Johns Hopkins 34,400 35,900 4.4 Tufts 45,000 46,860 4.1RPI 33,496 35,885 7.1 Washington U. 44,602 46,776 4.9Chicago 34,005 35,868 5.5 U. Pennsylvania 44,212 46,450 5.1Duke 34,067 35,620 4.6 Boston U. 44,272 46,368 4.7Washington U. 33,788 35,524 5.1 RPI 43,411 46,305 6.7Northwestern 33,567 35,429 5.5 Northwestern 43,833 46,205 5.4Boston U. 33,792 35,418 4.8 <strong>Cornell</strong> (Endowed) 43,757 46,021 5.2NYU 33,420 35,290 5.6 Brown 43,754 45,948 5.0Rochester 33,426 35,190 5.3 Stanford 43,631 45,897 5.2Dartmouth 33,501 35,178 5.0 Rochester 43,618 45,830 5.1Stanford 33,264 35,089 5.5 Harvard 43,655 45,620 4.5Harvard 33,709 34,998 3.8 Dartmouth 43,341 45,483 4.9MIT 33,600 34,986 4.1 Duke 43,407 45,400 4.6<strong>Cornell</strong> (Endowed) 32,981 34,781 5.5 MIT 43,550 45,386 4.2Yale 33,030 34,530 4.5 Yale 43,050 45,000 4.5Princeton 33,675 33,780 0.3 <strong>Cornell</strong> (Contract-nonres.) 42,657 44,921 5.3<strong>Cornell</strong> (Contract-nonres.) 31,881 33,681 5.6 Princeton 42,875 44,760 4.4U. Michigan (nonres.) 29,131 31,301 7.4 UC–Berkeley (nonres.) 38,412 40,633 5.8U. Virginia (nonres.) 25,945 27,940 7.7 U. Michigan (nonres.) 36,939 39,491 6.9UC–Berkeley (nonres.) 25,338 26,785 5.7 U. Virginia (nonres.) 32,854 35,375 7.7Pennsylvania State (nonres.) 22,712 23,712 4.4 Pennsylvania State (nonres.) 30,128 31,452 4.4Michigan State (nonres.) 21,538 23,699 10.0 <strong>Cornell</strong> (Contract-res.) 29,017 30,531 5.2Rutgers (nonres.) 18,463 19,783 7.1 Michigan State (nonres.) 27,632 30,425 10.1<strong>Cornell</strong> (Contract-res.) 18,241 19,291 5.8 Rutgers (nonres.) 27,775 29,545 6.4SUNY–Buffalo (nonres.) 12,389 12,478 0.7 SUNY–Binghamton (nonres.) 20,768 21,460 3.3SUNY–Binghamton (nonres.) 12,180 12,272 0.8 SUNY–Buffalo (nonres.) 20,497 21,098 2.9SUNY–Buffalo (res.) 6,129 6,218 1.5 SUNY–Binghamton (res.) 14,508 15,200 4.8SUNY–Binghamton (res.) 5,920 6,012 1.6 SUNY–Buffalo (res.) 14,237 14,838 4.2Notes: • Institutions are ranked in descending order <strong>of</strong> rates for 2007-08.• Institutions with different resident and nonresident tuitions are indicated res. and nonres. respectively.• Common acceptance refers to institutions that had significant overlap with <strong>Cornell</strong> in the common acceptance<strong>of</strong> students who eventually matriculated at <strong>Cornell</strong> rather than those other institutions.63
- Page 5 and 6:
Operating plan - highlightsIntroduc
- Page 8:
Operating plan - highlightsComposit
- Page 11 and 12: Tuition, Financial Aid & Endowmentm
- Page 13 and 14: Tuition, Financial Aid & Endowmentu
- Page 15 and 16: Tuition, Financial Aid & EndowmentC
- Page 17 and 18: Tuition, Financial Aid & Endowmentf
- Page 19 and 20: Tuition, Financial Aid & EndowmentD
- Page 21 and 22: Tuition, Financial Aid & EndowmentC
- Page 23 and 24: Tuition, Financial Aid & EndowmentS
- Page 25 and 26: Tuition, Financial Aid & Endowmentw
- Page 27: Tuition, Financial Aid & Endowmentt
- Page 31 and 32: Tuition, Financial Aid & Endowmentp
- Page 33 and 34: Operating plan - DetailsIthaca Camp
- Page 35 and 36: Operating plan - DetailsSignificant
- Page 37 and 38: Operating plan - Detailstive staff
- Page 39 and 40: Operating plan - Detailsand develop
- Page 41 and 42: Operating plan - DetailsCentrallyOt
- Page 43 and 44: Operating plan - DetailsMedical Col
- Page 45 and 46: Capital PlanDistribution of Space -
- Page 47 and 48: Capital Plan• New York State supp
- Page 49 and 50: Capital PlanFUNDING SOURCESFINANCIN
- Page 51 and 52: Capital PlanEXPENDITURE PATTERNEsti
- Page 53 and 54: Capital PlanFUNDING SOURCESFINANCIN
- Page 55 and 56: Capital PlanEXPENDITURE PATTERNEsti
- Page 57 and 58: Capital PlanEXPENDITURE PATTERNEsti
- Page 59 and 60: Capital PlanDebt Service by Operati
- Page 61: BStudent Fees and Other Tuition Rat
- Page 65 and 66: FAverage Nine-Month Faculty Salarie
- Page 67 and 68: HNew York State AppropriationsSourc
- Page 69 and 70: JInvestment Assets, Returns, and Pa
- Page 71 and 72: LGifts/Contributions - Through Marc
- Page 73 and 74: NWorkforce - Ithaca Campus2007-08 I
- Page 75 and 76: PU.S. Senate ResponseThe Senate Com
- Page 77 and 78: U.S. Senate Response (continued)of
- Page 79 and 80: U.S. Senate Response (continued)inc
- Page 81 and 82: U.S. Senate Response (continued)fro
- Page 83 and 84: U.S. Senate Response (continued)Tab
- Page 85 and 86: U.S. Senate Response (continued)Tab
- Page 87 and 88: U.S. Senate Response (continued)Tab