SILVER BULLETS - Espirito Santo Investment Bank incorporating ...
SILVER BULLETS - Espirito Santo Investment Bank incorporating ...
SILVER BULLETS - Espirito Santo Investment Bank incorporating ...

Create successful ePaper yourself
Turn your PDF publications into a flip-book with our unique Google optimized e-Paper software.
THIRD QUARTER 2010<br />
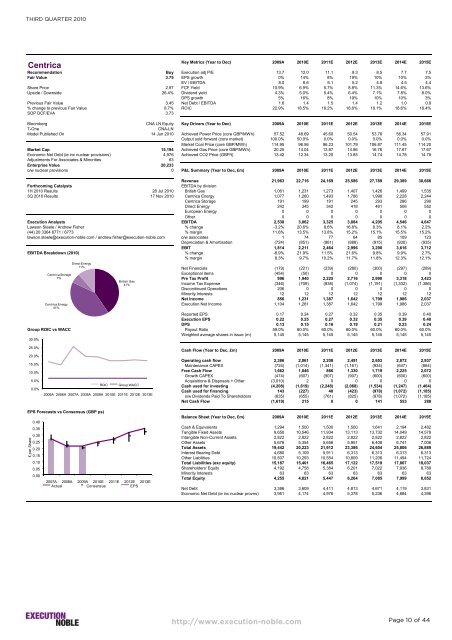
Centrica<br />
25.0%<br />
20.0%<br />
15.0%<br />
10.0%<br />
£ per Share<br />
5.0%<br />
0.0%<br />
0.40<br />
0.35<br />
0.30<br />
0.25<br />
0.20<br />
0.15<br />
0.10<br />
0.05<br />
0.00<br />
Centrica Storage<br />
7%<br />
Centrica Energy<br />
41%<br />
Direct Energy<br />
11%<br />
British Gas<br />
41%<br />
ROIC Group WACC<br />
2005A 2006A 2007A 2008A 2009A 2010E 2011E 2012E 2013E<br />
2007A 2008A 2009A 2010E 2011E 2012E 2013E<br />
Actual Consensus EPS<br />
Key Metrics (Year to Dec) 2009A 2010E 2011E 2012E 2013E 2014E 2015E<br />
Recommendation Buy Execution adj P/E 13.7 12.0 11.1 9.3 8.5 7.7 7.5<br />
Fair Value 3.75 EPS growth 0% 14% 8% 19% 10% 10% 3%<br />
EV / EBITDA 8.0 6.6 6.1 5.2 4.8 4.5 4.4<br />
Share Price 2.97 FCF Yield 10.9% 6.9% 5.7% 8.8% 11.3% 14.6% 13.6%<br />
Upside / Downside 26.4% Dividend yield 4.3% 5.0% 5.4% 6.4% 7.1% 7.8% 8.0%<br />
DPS growth 5% 16% 8% 19% 10% 10% 3%<br />
Previous Fair Value 3.45 Net Debt / EBITDA 1.6 1.4 1.5 1.4 1.2 1.0 0.9<br />
% change to previous Fair Value 8.7% ROIC 22.9% 18.5% 18.2% 18.6% 18.1% 18.6% 18.4%<br />
SOP DCF/EVA 3.73<br />
Bloomberg CNA LN Equity Key Drivers (Year to Dec) 2009A 2010E 2011E 2012E 2013E 2014E 2015E<br />
T-One CNA-LN<br />
Model Published On 14 Jun 2010 Achieved Power Price (core GBP/MWh) 57.52 48.69 45.60 50.54 53.76 56.34 57.91<br />
Output sold forward (core market) 100.0% 50.0% 0.0% 0.0% 0.0% 0.0% 0.0%<br />
Market Coal Price (core GBP/MWh) 114.95 96.56 96.23 101.79 106.87 111.45 114.20<br />
Market Cap 15,194 Achieved Gas Price (core GBP/MWh) 20.25 14.04 13.87 14.86 16.76 17.67 17.67<br />
Economic Net Debt (ie inc nuclear provisions) 4,976 Achieved CO2 Price (GBP/t) 13.42 12.34 13.25 13.85 14.74 14.78 14.78<br />
Adjustments For Associates & Minorities 63<br />
Enterprise Value 20,233<br />
o/w nuclear provisions 0 P&L Summary (Year to Dec, £m) 2009A 2010E 2011E 2012E 2013E 2014E 2015E<br />
Revenue 21,963 22,716 24,169 25,586 27,789 29,389 30,666<br />
Forthcoming Catalysts EBITDA by division<br />
1H 2010 Results 28 Jul 2010 British Gas 1,061 1,231 1,273 1,407 1,426 1,499 1,535<br />
3Q 2010 Results 17 Nov 2010 Centrica Energy 1,077 1,260 1,493 1,786 1,998 2,228 2,244<br />
Centrica Storage 191 199 191 245 293 286 290<br />
Direct Energy 242 345 342 418 461 506 552<br />
European Energy 0 0 0 0 0 0 0<br />
Other 0 0 0 0 0 0 0<br />
Execution Analysts EBITDA 2,538 3,062 3,325 3,884 4,205 4,546 4,647<br />
Lawson Steele / Andrew Fisher % change -3.2% 20.6% 8.6% 16.8% 8.3% 8.1% 2.2%<br />
(44) 20 3364 6771 / 6773 % margin 11.6% 13.5% 13.8% 15.2% 15.1% 15.5% 15.2%<br />
lawson.steele@execution-noble.com / andrew.fisher@execution-noble.com o/w associates 1 74 77 64 85 109 123<br />
Depreciation & Amortisation (724) (851) (861) (888) (915) (930) (935)<br />
EBIT 1,814 2,211 2,464 2,996 3,290 3,616 3,712<br />
EBITDA Breakdown (2010) % change -8.9% 21.9% 11.5% 21.6% 9.8% 9.9% 2.7%<br />
% margin 8.3% 9.7% 10.2% 11.7% 11.8% 12.3% 12.1%<br />
Net Financials (179) (221) (239) (280) (300) (297) (289)<br />
Exceptional items (454) (50) 0 0 0 0 0<br />
Pre Tax Profit 996 1,940 2,225 2,716 2,990 3,318 3,423<br />
Income Tax Expense (346) (709) (838) (1,074) (1,191) (1,332) (1,386)<br />
Disconitinued Operations 206 0 0 0 0 0 0<br />
Minority Interests 12 12 12 12 12 12 12<br />
Net Income 856 1,231 1,387 1,642 1,799 1,986 2,037<br />
Execution Net Income 1,104 1,281 1,387 1,642 1,799 1,986 2,037<br />
Reported EPS 0.17 0.24 0.27 0.32 0.35 0.39 0.40<br />
Execution EPS 0.22 0.25 0.27 0.32 0.35 0.39 0.40<br />
DPS 0.13 0.15 0.16 0.19 0.21 0.23 0.24<br />
Group ROIC vs WACC Payout Ratio 59.0% 60.0% 60.0% 60.0% 60.0% 60.0% 60.0%<br />
30.0%<br />
Weighted average shares in issue (m) 5,145 5,145 5,145 5,145 5,145 5,145 5,145<br />
EPS Forecasts vs Consensus (GBP ps)<br />
Cash Flow (Year to Dec, £m) 2009A 2010E 2011E 2012E 2013E 2014E 2015E<br />
Operating cash flow 2,386 2,061 2,208 2,491 2,653 2,872 2,937<br />
Maintenance CAPEX (724) (1,014) (1,341) (1,161) (934) (647) (864)<br />
Free Cash Flow 1,662 1,046 866 1,330 1,719 2,225 2,072<br />
Growth CAPEX (474) (607) (907) (907) (600) (600) (600)<br />
Acquisitions & Disposals + Other (3,010) 2 0 0 0 0 0<br />
Cash used for investing (4,208) (1,619) (2,248) (2,068) (1,534) (1,247) (1,464)<br />
Cash used for financing 143 (227) 40 (423) (978) (1,072) (1,185)<br />
o/w Dividends Paid To Shareholders (635) (655) (761) (825) (978) (1,072) (1,185)<br />
Net Cash Flow (1,619) 215 0 0 141 553 288<br />
Balance Sheet (Year to Dec, £m) 2009A 2010E 2011E 2012E 2013E 2014E 2015E<br />
Cash & Equivalents 1,294 1,500 1,500 1,500 1,641 2,194 2,482<br />
Tangible Fixed Assets 9,650 10,546 11,934 13,113 13,732 14,049 14,579<br />
Intangible Non-Current Assets 2,822 2,822 2,822 2,822 2,822 2,822 2,822<br />
Other Assets 5,676 5,354 5,656 5,951 6,408 6,741 7,006<br />
Total Assets 19,442 20,223 21,912 23,386 24,604 25,806 26,889<br />
Interest Bearing Debt 4,680 5,109 5,911 6,313 6,313 6,313 6,313<br />
Other Liabilities 10,507 10,293 10,554 10,809 11,206 11,494 11,724<br />
Total Liabilities (exc equity) 15,187 15,401 16,465 17,122 17,519 17,807 18,037<br />
Shareholders' Equity 4,192 4,758 5,384 6,201 7,022 7,936 8,789<br />
Minority Interests 63 63 63 63 63 63 63<br />
Total Equity 4,255 4,821 5,447 6,264 7,085 7,999 8,852<br />
Net Debt 3,386 3,609 4,411 4,813 4,671 4,119 3,831<br />
Economic Net Debt (ie inc nuclear provns) 3,951 4,174 4,976 5,378 5,236 4,684 4,396<br />
http://www.execution-noble.com<br />
Page 10 of 44