SILVER BULLETS - Espirito Santo Investment Bank incorporating ...
SILVER BULLETS - Espirito Santo Investment Bank incorporating ...
SILVER BULLETS - Espirito Santo Investment Bank incorporating ...

You also want an ePaper? Increase the reach of your titles
YUMPU automatically turns print PDFs into web optimized ePapers that Google loves.
THIRD QUARTER 2010<br />
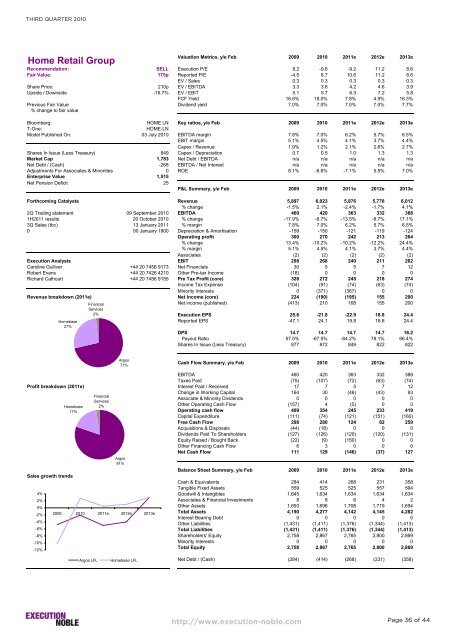
Home Retail Group<br />
Valuation Metrics, y/e Feb 2009 2010 2011e 2012e 2013e<br />
Recommendation: SELL Execution P/E 8.2 -9.6 -9.2 11.2 8.6<br />
Fair Value: 175p Reported P/E -4.5 8.7 10.6 11.2 8.6<br />
EV / Sales 0.3 0.3 0.3 0.3 0.3<br />
Share Price: 210p EV / EBITDA 3.3 3.6 4.2 4.6 3.9<br />
Upside / Downside -16.7% EV / EBIT 5.1 5.7 6.3 7.2 5.8<br />
FCF Yield 18.6% 18.0% 7.8% 4.9% 16.3%<br />
Previous Fair Value Dividend yield 7.0% 7.0% 7.0% 7.0% 7.7%<br />
% change to fair value<br />
Bloomberg: HOME LN Key ratios, y/e Feb 2009 2010 2011e 2012e 2013e<br />
T-One: HOME-LN<br />
Model Published On: 03 July 2010 EBITDA margin 7.8% 7.0% 6.2% 5.7% 6.5%<br />
EBIT margin 5.1% 4.5% 4.1% 3.7% 4.4%<br />
Capex / Revenue 1.9% 1.2% 2.1% 2.6% 2.7%<br />
Shares In Issue (Less Treasury) 849 Capex / Depreciation 0.7 0.5 1.0 1.3 1.3<br />
Market Cap 1,783 Net Debt / EBITDA n/a n/a n/a n/a n/a<br />
Net Debt / (Cash) -268 EBITDA / Net Interest n/a n/a n/a n/a n/a<br />
Adjustments For Associates & Minorities 0 ROE 8.1% -6.6% -7.1% 5.5% 7.0%<br />
Enterprise Value 1,515<br />
Net Pension Deficit 25<br />
P&L Summary, y/e Feb 2009 2010 2011e 2012e 2013e<br />
Forthcoming Catalysts Revenue 5,897 6,023 5,876 5,776 6,012<br />
% change -1.5% 2.1% -2.4% -1.7% 4.1%<br />
2Q Trading statement 09 September 2010 EBITDA 460 420 363 332 388<br />
1H2011 results 20 October 2010 % change -17.9% -8.7% -13.5% -8.7% 17.1%<br />
3Q Sales (tbc) 13 January 2011 % margin 7.8% 7.0% 6.2% 5.7% 6.5%<br />
0 00 January 1900 Depreciation & Amortisation -159 -150 -121 -119 -124<br />
Operating profit 300 270 242 213 264<br />
% change 13.4% -10.2% -10.2% -12.2% 24.4%<br />
% margin 5.1% 4.5% 4.1% 3.7% 4.4%<br />
Associates (2) (2) (2) (2) (2)<br />
Execution Analysts EBIT 298 268 240 211 262<br />
Caroline Gulliver +44 20 7456 9173 Net Financials 30 5 5 7 12<br />
Robert Evans +44 20 7426 4210 Other Pre-tax Income (18) 0 0 0 0<br />
Richard Cathcart +44 20 7456 9155 Pre Tax Profit (core) 328 272 245 218 274<br />
Income Tax Expense (104) (91) (74) (63) (74)<br />
Minority Interests 0 (371) (367) 0 0<br />
Revenue breakdown (2011e) Net Income (core) 224 (190) (195) 155 200<br />
Net income (published) (413) 210 168 155 200<br />
Execution EPS 25.6 -21.8 -22.9 18.8 24.4<br />
Reported EPS -47.1 24.1 19.8 18.8 24.4<br />
DPS 14.7 14.7 14.7 14.7 16.2<br />
Payout Ratio 57.5% -67.5% -64.2% 78.1% 66.4%<br />
Shares In Issue (Less Treasury) 877 872 849 822 822<br />
Argos<br />
71%<br />
Cash Flow Summary, y/e Feb 2009 2010 2011e 2012e 2013e<br />
EBITDA 460 420 363 332 388<br />
Taxes Paid (75) (107) (72) (63) (74)<br />
Profit breakdown (2011e) Interest Paid / Received 17 7 5 7 12<br />
Sales growth trends<br />
4%<br />
2%<br />
0%<br />
-2%<br />
-4%<br />
-6%<br />
-8%<br />
-10%<br />
-12%<br />
Homebase<br />
27%<br />
Homebase<br />
17%<br />
Financial<br />
Services<br />
2%<br />
Financial<br />
Services<br />
2%<br />
Argos<br />
81%<br />
2009 2010 2011e 2012e 2013e<br />
Argos LFL Homebase LFL<br />
Change in Working Capital 164 30 (46) (43) 93<br />
Associate & Minority Dividends 0 0 0 0 0<br />
Other Operating Cash Flow (157) 4 (5) 0 0<br />
Operating cash flow 409 354 245 233 419<br />
Capital Expenditure (111) (74) (121) (151) (160)<br />
Free Cash Flow 298 280 124 82 259<br />
Acquisitions & Disposals (44) (18) 0 0 0<br />
Dividends Paid To Shareholders (127) (126) (120) (120) (131)<br />
Equity Raised / Bought Back (22) (9) (150) 0 0<br />
Other Financing Cash Flow 6 3 0 0 0<br />
Net Cash Flow 111 129 (146) (37) 127<br />
Balance Sheet Summary, y/e Feb 2009 2010 2011e 2012e 2013e<br />
Cash & Equivalents 284 414 268 231 358<br />
Tangible Fixed Assets 559 525 525 557 594<br />
Goodwill & Intangibles 1,645 1,634 1,634 1,634 1,634<br />
Associates & Financial <strong>Investment</strong>s 8 8 6 4 2<br />
Other Assets 1,693 1,696 1,708 1,719 1,694<br />
Total Assets 4,190 4,277 4,142 4,145 4,282<br />
Interest Bearing Debt 0 0 0 0 0<br />
Other Liabilities (1,431) (1,411) (1,376) (1,344) (1,413)<br />
Total Liabilities (1,431) (1,411) (1,376) (1,344) (1,413)<br />
Shareholders' Equity 2,758 2,867 2,765 2,800 2,869<br />
Minority Interests 0 0 0 0 0<br />
Total Equity 2,758 2,867 2,765 2,800 2,869<br />
Net Debt / (Cash) (284) (414) (268) (231) (358)<br />
http://www.execution-noble.com<br />
Page 36 of 44