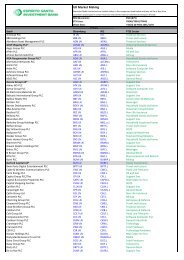
SILVER BULLETS - Espirito Santo Investment Bank incorporating ...
SILVER BULLETS - Espirito Santo Investment Bank incorporating ...
SILVER BULLETS - Espirito Santo Investment Bank incorporating ...

Create successful ePaper yourself
Turn your PDF publications into a flip-book with our unique Google optimized e-Paper software.
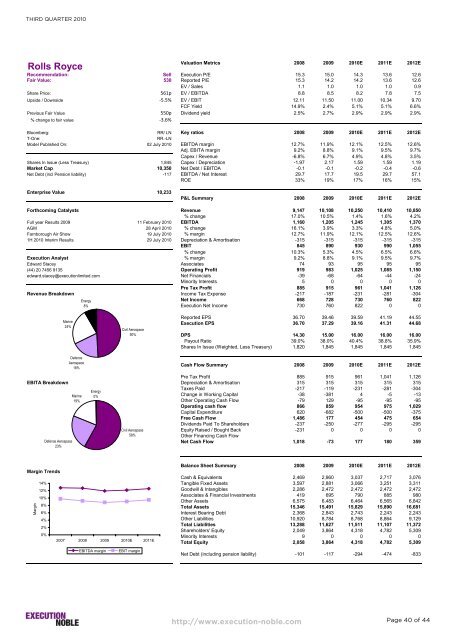
THIRD QUARTER 2010<br />
Rolls Royce<br />
Valuation Metrics 2008 2009 2010E 2011E 2012E<br />
Recommendation: Sell Execution P/E 15.3 15.0 14.3 13.6 12.6<br />
Fair Value: 530 Reported P/E 15.3 14.2 14.2 13.6 12.6<br />
EV / Sales 1.1 1.0 1.0 1.0 0.9<br />
Share Price: 561p EV / EBITDA 8.8 8.5 8.2 7.8 7.5<br />
Upside / Downside -5.5% EV / EBIT 12.11 11.50 11.00 10.34 9.70<br />
FCF Yield 14.9% 2.4% 5.1% 5.1% 6.6%<br />
Previous Fair Value 550p Dividend yield 2.5% 2.7% 2.9% 2.9% 2.9%<br />
% change to fair value -3.6%<br />
Bloomberg: RR/ LN Key ratios 2008 2009 2010E 2011E 2012E<br />
T-One: RR.-LN<br />
Model Published On: 02 July 2010 EBITDA margin 12.7% 11.9% 12.1% 12.5% 12.6%<br />
Adj. EBITA margin 9.2% 8.8% 9.1% 9.5% 9.7%<br />
Capex / Revenue -6.8% 6.7% 4.9% 4.8% 3.5%<br />
Shares In Issue (Less Treasury) 1,845 Capex / Depreciation -1.97 2.17 1.59 1.59 1.19<br />
Market Cap 10,350 Net Debt / EBITDA -0.1 -0.1 -0.2 -0.4 -0.6<br />
Net Debt (incl Pension liability) -117 EBITDA / Net Interest 29.7 17.7 19.5 29.7 57.1<br />
ROE 33% 19% 17% 16% 15%<br />
Enterprise Value 10,233<br />
P&L Summary 2008 2009 2010E 2011E 2012E<br />
Forthcoming Catalysts Revenue 9,147 10,108 10,250 10,410 10,850<br />
% change 17.0% 10.5% 1.4% 1.6% 4.2%<br />
Full year Results 2009 11 February 2010 EBITDA 1,160 1,205 1,245 1,305 1,370<br />
AGM 28 April 2010 % change 16.1% 3.9% 3.3% 4.8% 5.0%<br />
Farnborough Air Show 19 July 2010 % margin 12.7% 11.9% 12.1% 12.5% 12.6%<br />
1H 2010 Interim Results 29 July 2010 Depreciation & Amortisation -315 -315 -315 -315 -315<br />
EBIT 845 890 930 990 1,055<br />
% change 10.3% 5.3% 4.5% 6.5% 6.6%<br />
Execution Analyst % margin 9.2% 8.8% 9.1% 9.5% 9.7%<br />
Edward Stacey Associates 74 93 95 95 95<br />
(44) 20 7456 9135 Operating Profit 919 983 1,025 1,085 1,150<br />
edward.stacey@executionlimited.com Net Financials -39 -68 -64 -44 -24<br />
Minority Interests 5 0 0 0 0<br />
Pre Tax Profit 885 915 961 1,041 1,126<br />
Revenue Breakdown Income Tax Expense -217 -187 -231 -281 -304<br />
Net Income 668 728 730 760 822<br />
Execution Net Income 730 760 822 0 0<br />
Reported EPS 36.70 39.46 39.59 41.19 44.55<br />
Execution EPS 36.70 37.29 39.16 41.31 44.68<br />
DPS 14.30 15.00 16.00 16.00 16.00<br />
Payout Ratio 39.0% 38.0% 40.4% 38.8% 35.9%<br />
Shares In Issue (Weighted, Less Treasury) 1,820 1,845 1,845 1,845 1,845<br />
Defence<br />
Aerospace<br />
18%<br />
Cash Flow Summary 2008 2009 2010E 2011E 2012E<br />
Pre Tax Profit 885 915 961 1,041 1,126<br />
EBITA Breakdown Depreciation & Amortisation 315 315 315 315 315<br />
Margin Trends<br />
Margin<br />
14%<br />
12%<br />
10%<br />
8%<br />
6%<br />
4%<br />
2%<br />
0%<br />
Marine<br />
24%<br />
Defence Aerospace<br />
23%<br />
Marine<br />
19%<br />
Energy<br />
8%<br />
Energy<br />
0%<br />
Civil Aerospace<br />
50%<br />
Civil Aerospace<br />
58%<br />
2007 2008 2009 2010E 2011E<br />
Adj. EBITDA margin Adj. EBIT EBIT margin margin<br />
Taxes Paid -217 -119 -231 -281 -304<br />
Change in Working Capital -38 -381 4 -5 -13<br />
Other Operating Cash Flow -79 129 -95 -95 -95<br />
Operating cash flow 866 859 954 975 1,029<br />
Capital Expenditure 620 -682 -500 -500 -375<br />
Free Cash Flow 1,486 177 454 475 654<br />
Dividends Paid To Shareholders -237 -250 -277 -295 -295<br />
Equity Raised / Bought Back -231 0 0 0 0<br />
Other Financing Cash Flow<br />
Net Cash Flow 1,018 -73 177 180 359<br />
Balance Sheet Summary 2008 2009 2010E 2011E 2012E<br />
Cash & Equivalents 2,469 2,960 3,037 2,717 3,076<br />
Tangible Fixed Assets 3,597 2,881 3,066 3,251 3,311<br />
Goodwill & Intangibles 2,286 2,472 2,472 2,472 2,472<br />
Associates & Financial <strong>Investment</strong>s 419 695 790 885 980<br />
Other Assets 6,575 6,483 6,464 6,565 6,842<br />
Total Assets 15,346 15,491 15,829 15,890 16,681<br />
Interest Bearing Debt 2,368 2,843 2,743 2,243 2,243<br />
Other Liabilities 10,920 8,784 8,768 8,864 9,129<br />
Total Liabilities 13,288 11,627 11,511 11,107 11,372<br />
Shareholders' Equity 2,049 3,864 4,318 4,782 5,309<br />
Minority Interests 9 0 0 0 0<br />
Total Equity 2,058 3,864 4,318 4,782 5,309<br />
Net Debt (including pension liability) -101 -117 -294 -474 -833<br />
http://www.execution-noble.com<br />
Page 40 of 44