SILVER BULLETS - Espirito Santo Investment Bank incorporating ...
SILVER BULLETS - Espirito Santo Investment Bank incorporating ...
SILVER BULLETS - Espirito Santo Investment Bank incorporating ...

Create successful ePaper yourself
Turn your PDF publications into a flip-book with our unique Google optimized e-Paper software.
THIRD QUARTER 2010<br />
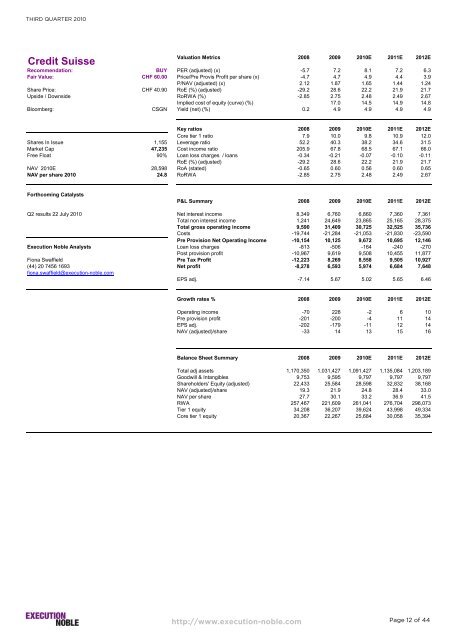
Credit Suisse<br />
Valuation Metrics 2008 2009 2010E 2011E 2012E<br />
Recommendation: BUY PER (adjusted) (x) -5.7 7.2 8.1 7.2 6.3<br />
Fair Value: CHF 60.00 Price/Pre Provis Profit per share (x) -4.7 4.7 4.9 4.4 3.9<br />
P/NAV (adjusted) (x) 2.12 1.87 1.65 1.44 1.24<br />
Share Price: CHF 40.90 RoE (%) (adjusted) -29.2 28.6 22.2 21.9 21.7<br />
Upside / Downside RoRWA (%) -2.85 2.75 2.48 2.49 2.67<br />
Implied cost of equity (curve) (%) 17.0 14.5 14.9 14.8<br />
Bloomberg: CSGN Yield (net) (%) 0.2 4.9 4.9 4.9 4.9<br />
Key ratios 2008 2009 2010E 2011E 2012E<br />
Core tier 1 ratio 7.9 10.0 9.8 10.9 12.0<br />
Shares In Issue 1,155 Leverage ratio 52.2 40.3 38.2 34.6 31.5<br />
Market Cap 47,235 Cost income ratio 205.9 67.8 68.5 67.1 66.0<br />
Free Float 90% Loan loss charges / loans -0.34 -0.21 -0.07 -0.10 -0.11<br />
RoE (%) (adjusted) -29.2 28.6 22.2 21.9 21.7<br />
NAV 2010E 28,598 RoA (stated) -0.65 0.60 0.56 0.60 0.65<br />
NAV per share 2010 24.8 RoRWA -2.85 2.75 2.48 2.49 2.67<br />
Forthcoming Catalysts<br />
P&L Summary 2008 2009 2010E 2011E 2012E<br />
Q2 results 22 July 2010 Net interest income 8,349 6,760 6,860 7,360 7,361<br />
Total non interest income 1,241 24,649 23,865 25,165 28,375<br />
Total gross operating income 9,590 31,409 30,725 32,525 35,736<br />
Costs -19,744 -21,284 -21,053 -21,830 -23,590<br />
Pre Provision Net Operating Income -10,154 10,125 9,672 10,695 12,146<br />
Execution Noble Analysts Loan loss charges -813 -506 -164 -240 -270<br />
Post provision profit -10,967 9,619 9,508 10,455 11,877<br />
Fiona Swaffield Pre Tax Profit -12,223 8,269 8,558 9,505 10,927<br />
(44) 20 7456 1693 Net profit -8,278 6,593 5,974 6,684 7,648<br />
fiona.swaffield@execution-noble.com<br />
EPS adj. -7.14 5.67 5.02 5.65 6.46<br />
Growth rates % 2008 2009 2010E 2011E 2012E<br />
Operating income -70 228 -2 6 10<br />
Pre provision profit -201 -200 -4 11 14<br />
EPS adj. -202 -179 -11 12 14<br />
NAV (adjusted)/share -33 14 13 15 16<br />
Balance Sheet Summary 2008 2009 2010E 2011E 2012E<br />
Total adj assets 1,170,350 1,031,427 1,091,427 1,135,084 1,203,189<br />
Goodwill & Intangibles 9,753 9,595 9,797 9,797 9,797<br />
Shareholders' Equity (adjusted) 22,433 25,584 28,598 32,832 38,168<br />
NAV (adjusted)/share 19.3 21.9 24.8 28.4 33.0<br />
NAV per share 27.7 30.1 33.2 36.9 41.5<br />
RWA 257,467 221,609 261,041 276,704 296,073<br />
Tier 1 equity 34,208 36,207 39,624 43,998 49,334<br />
Core tier 1 equity 20,367 22,267 25,684 30,058 35,394<br />
http://www.execution-noble.com<br />
Page 12 of 44