SILVER BULLETS - Espirito Santo Investment Bank incorporating ...
SILVER BULLETS - Espirito Santo Investment Bank incorporating ...
SILVER BULLETS - Espirito Santo Investment Bank incorporating ...

You also want an ePaper? Increase the reach of your titles
YUMPU automatically turns print PDFs into web optimized ePapers that Google loves.
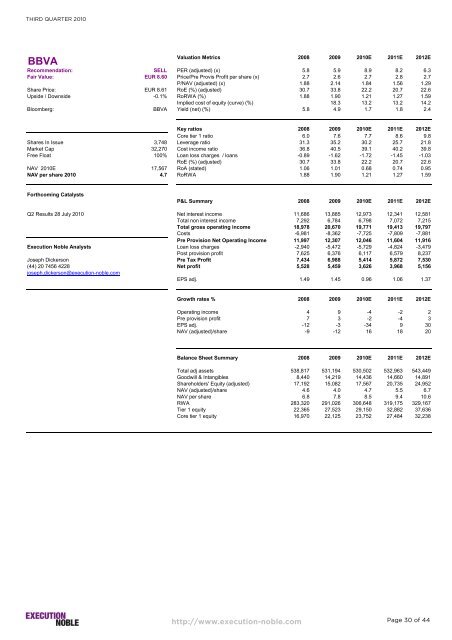
THIRD QUARTER 2010<br />
BBVA<br />
Valuation Metrics 2008 2009 2010E 2011E 2012E<br />
Recommendation: SELL PER (adjusted) (x) 5.8 5.9 8.9 8.2 6.3<br />
Fair Value: EUR 8.60 Price/Pre Provis Profit per share (x) 2.7 2.6 2.7 2.8 2.7<br />
P/NAV (adjusted) (x) 1.88 2.14 1.84 1.56 1.29<br />
Share Price: EUR 8.61 RoE (%) (adjusted) 30.7 33.8 22.2 20.7 22.6<br />
Upside / Downside -0.1% RoRWA (%) 1.88 1.90 1.21 1.27 1.59<br />
Implied cost of equity (curve) (%) 18.3 13.2 13.2 14.2<br />
Bloomberg: BBVA Yield (net) (%) 5.8 4.9 1.7 1.8 2.4<br />
Key ratios 2008 2009 2010E 2011E 2012E<br />
Core tier 1 ratio 6.0 7.6 7.7 8.6 9.8<br />
Shares In Issue 3,748 Leverage ratio 31.3 35.2 30.2 25.7 21.8<br />
Market Cap 32,270 Cost income ratio 36.8 40.5 39.1 40.2 39.8<br />
Free Float 100% Loan loss charges / loans -0.89 -1.62 -1.72 -1.45 -1.03<br />
RoE (%) (adjusted) 30.7 33.8 22.2 20.7 22.6<br />
NAV 2010E 17,567 RoA (stated) 1.06 1.01 0.68 0.74 0.95<br />
NAV per share 2010 4.7 RoRWA 1.88 1.90 1.21 1.27 1.59<br />
Forthcoming Catalysts<br />
P&L Summary 2008 2009 2010E 2011E 2012E<br />
Q2 Results 28 July 2010 Net interest income 11,686 13,885 12,973 12,341 12,581<br />
Total non interest income 7,292 6,784 6,798 7,072 7,215<br />
Total gross operating income 18,978 20,670 19,771 19,413 19,797<br />
Costs -6,981 -8,362 -7,725 -7,809 -7,881<br />
Pre Provision Net Operating Income 11,997 12,307 12,046 11,604 11,916<br />
Execution Noble Analysts Loan loss charges -2,940 -5,472 -5,729 -4,824 -3,479<br />
Post provision profit 7,625 6,376 6,117 6,579 8,237<br />
Joseph Dickerson Pre Tax Profit 7,434 6,988 5,414 5,872 7,530<br />
(44) 20 7456 4228 Net profit 5,528 5,459 3,626 3,968 5,156<br />
joseph.dickerson@execution-noble.com<br />
EPS adj. 1.49 1.45 0.96 1.06 1.37<br />
Growth rates % 2008 2009 2010E 2011E 2012E<br />
Operating income 4 9 -4 -2 2<br />
Pre provision profit 7 3 -2 -4 3<br />
EPS adj. -12 -3 -34 9 30<br />
NAV (adjusted)/share -9 -12 16 18 20<br />
Balance Sheet Summary 2008 2009 2010E 2011E 2012E<br />
Total adj assets 538,817 531,194 530,502 532,963 543,449<br />
Goodwill & Intangibles 8,440 14,219 14,436 14,660 14,891<br />
Shareholders' Equity (adjusted) 17,192 15,082 17,567 20,735 24,952<br />
NAV (adjusted)/share 4.6 4.0 4.7 5.5 6.7<br />
NAV per share 6.8 7.8 8.5 9.4 10.6<br />
RWA 283,320 291,026 306,648 319,175 329,167<br />
Tier 1 equity 22,365 27,523 29,150 32,882 37,636<br />
Core tier 1 equity 16,970 22,125 23,752 27,484 32,238<br />
http://www.execution-noble.com<br />
Page 30 of 44