SILVER BULLETS - Espirito Santo Investment Bank incorporating ...
SILVER BULLETS - Espirito Santo Investment Bank incorporating ...
SILVER BULLETS - Espirito Santo Investment Bank incorporating ...

Create successful ePaper yourself
Turn your PDF publications into a flip-book with our unique Google optimized e-Paper software.
THIRD QUARTER 2010<br />
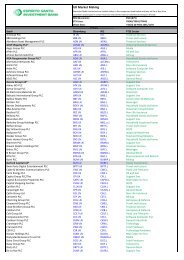
Figure 1: Looking back at Q2 performance<br />
(1) Silver Bullet sector relative performance measures stock performance relative to a corresponding net (long or short) investment in the relevant sector index<br />
(2) Silver Bullet market relative performance measures stock and sector performance relative to the move in the market (not adjusted for direction of call)<br />
(3) Silver Bullet portfolio alpha is an amalgamation of individual stock calls relative to a corrresponding position (long or short) in the market<br />
Performance based in € Quarterly Share Price Silver Bullet € Rebased Silver Bullet Sector Silver Bullet Market Silver Bullet Portfolio<br />
Move (local currency) Performance Relative Performance Relative Performance Market Alpha<br />
WPP Buy -7.0% 1.1% 6.5% 8.8% 9.5%<br />
Wolters Kluw er Sell -1.7% 1.7% -3.7% 9.4% -5.6%<br />
Silver Bullets Media 1.4% 6.8% 9.1% 1.4%<br />
Media Sector (SXMP) -5.4% -5.4%<br />
Cable & Wireless Coms Buy 4.3% 13.4% 19.6% 21.1% 22.8%<br />
Hellenic Telecom Buy -32.5% -32.5% -26.4% -24.8% -26.9%<br />
Deutsche Telecom Sell -3.3% 3.3% -2.8% 11.0% -4.0%<br />
Silver Bullets Telecom -5.3% 0.9% 2.4% -2.8%<br />
Telecom Sector (SXKP) -6.2% -6.2%<br />
Aviva Buy -18.6% -11.5% 0.6% -3.8% -4.1%<br />
AXA Buy -23.4% -23.4% -11.3% -15.7% -17.0%<br />
RSA Sell -6.2% -1.9% -14.1% 5.7% -8.9%<br />
Silver Bullets Insurance -12.3% -0.2% -4.6% -10.0%<br />
Insurance Sector (SXIP) -12.1% -12.1%<br />
Enterprise Inns Buy -29.1% -23.0% -19.6% -15.3% -16.5%<br />
DSGI Buy -29.0% -22.9% -19.5% -15.2% -16.5%<br />
Home Retail Sell -20.8% 14.0% 10.6% 21.7% 5.8%<br />
Silver Bullets Retail -10.6% -7.2% -2.9% -8.3%<br />
Retail Sector (SXRP) -3.4% -3.4%<br />
Lloyds <strong>Bank</strong>ing Group Buy -14.4% -7.0% 5.9% 0.7% 0.7%<br />
BNP Paribas Buy -21.2% -21.2% -8.3% -13.5% -14.6%<br />
Santander Sell -11.2% 11.2% -1.7% 18.9% 3.2%<br />
Nordea Sell -8.9% 6.8% -6.1% 14.5% -0.8%<br />
Silver Bullets <strong>Bank</strong>s -2.6% 10.4% 5.1% -2.6%<br />
<strong>Bank</strong>s Sector (SX7P) -12.9% -12.9%<br />
Pernod Ricard Buy 1.8% 1.8% -0.4% 9.5% 10.2%<br />
ABI Buy 6.7% 6.7% 4.5% 14.4% 15.6%<br />
L'Oreal Sell 4.0% -4.0% -1.8% 3.7% -10.9%<br />
Silver Bullets Consumer 1.5% -0.7% 9.2% 4.2%<br />
Consumer Sector (SX3P) 2.2% 2.2%<br />
Prysmian Buy -18.6% -18.6% 8.9% -10.9% -11.8%<br />
Qinetiq Buy -12.6% -5.0% 22.5% 2.7% 2.9%<br />
BAE Systems Sell -16.1% 8.9% -18.7% 16.5% 1.1%<br />
Silver Bullets Industrials -4.9% 22.6% 2.8% -2.4%<br />
Industrials Sector (SXNP) -27.5% -27.5%<br />
Suez Environment Buy -20.2% -20.2% -6.7% -12.5% -13.5%<br />
Silver Bullets Utilities -20.2% -6.7% -12.5% -13.5%<br />
Utilities Sector (SX6P) -13.5% -13.5%<br />
Silver Bullets Portfolio -6.8% -5.0% 2.7% -3.5%<br />
Market (SXXP) -7.7%<br />
Source: ExecutionNoble<br />
Figure 2: Indexed Performance and Benchmarks<br />
120<br />
110<br />
7 100<br />
0<br />
2<br />
e 90<br />
n<br />
u<br />
J<br />
to 80<br />
d<br />
e<br />
x<br />
e<br />
d 70<br />
In<br />
s<br />
rn<br />
60<br />
tu<br />
e<br />
R<br />
50<br />
40<br />
30<br />
Q2<br />
2007<br />
Source: ExecutionNoble<br />
Silver Bullets Absolute Performance<br />
Credit Suisse/Tremont Equity long/short (€)<br />
SXXP Index<br />
Q3<br />
2007<br />
Q4<br />
2007<br />
Q1<br />
2008<br />
Q2<br />
2008<br />
Q3<br />
2008<br />
Q4<br />
2008<br />
Q1<br />
2009<br />
Q2<br />
2009<br />
Q3<br />
2009<br />
Q4<br />
2009<br />
Q1<br />
2010<br />
Q2<br />
2010<br />
http://www.execution-noble.com<br />
Page 2 of 44