Fonds in Zahlen - FONDSXPRESS
Fonds in Zahlen - FONDSXPRESS
Fonds in Zahlen - FONDSXPRESS

You also want an ePaper? Increase the reach of your titles
YUMPU automatically turns print PDFs into web optimized ePapers that Google loves.
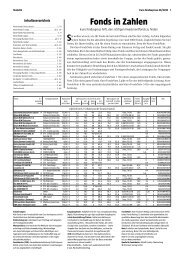
Statistik €uro fondsxpress 15/2011 1<br />
<strong>Fonds</strong> # = <strong>Fonds</strong>gesellschaft Rücknahme- Wertzuwachs <strong>in</strong> % per 14.04.2011 Wertzuwachs seit letzte Aus- <strong>Fonds</strong>- Ausgabe- <strong>Fonds</strong> ISIN<br />
Auslands- preis seit seit Rang seit 3 Jahren 5 Jahren schüttung/ kosten gebühr note<br />
fonds 14.04.2011 Vorwoche 01.01.11 2011 01.01.10 per 31.03.2010 Datum TER <strong>in</strong> % <strong>in</strong> %<br />
Aktienfonds (Schwerpunkt Asien ex Japan)<br />
Carlson Asian Small Cap # Carlson 4,73 € -0,7 -11,5 133 2,9 5,4 8,6 thes./31.12. 1,82 5≠ 5 LU0067059799<br />
Carlson Eq. Far East # Carlson 3,47 € -0,9 -1,9 5 21,7 33,2 49,7 thes./31.12. 1,33 5 2 LU0029400511<br />
Comgest Growth Asia ex Japan Dis. # Comgest S.A. 14,68 $ -2,9 -9,8 129 17,9 11,3 - - - 4≠ 2n IE00B16C1H01<br />
Comgest Panda # Comgest S.A. 2754,52 $ -2,8 -10,3 130 16,7 19,2 32,8 thes./30.09. - 5 2 LU0074144477<br />
ComSt. MSCI Pacific ex Jp. ETF # ETF: ComStage 47,37 $ -1,2 -3,6 23 24,6 - - thes./30.06. 0,45 0≠ LU0392495296<br />
CS ETF (IE) MSCI EM Asia B # ETF: Credit Suisse ( 117,43 $ -2,3 -5,4 66 - - - thes./31.07. 0,65 0≠ IE00B5L8K969<br />
CS ETF (IE) MSCI Pacific ex Japan B # ETF: Credit Suisse ( 113,07 $ -1,1 -3,6 24 19,5 - - thes./31.07. - 0≠ IE00B52MJY50<br />
dbx MSCI AC ASIA EX Japan TRN ETF # ETF: db x-trackers 34,65 $ -1,7 -5,4 68 21,6 - - thes./31.12. 0,65 0≠ LU0322252171<br />
dbx MSCI Pacific ex Japan TRN ETF # ETF: db x-trackers 47,16 $ -1,2 -3,3 16 21,7 - - thes./31.12. 0,45 0≠ LU0322252338<br />
db x-trackers MSCI EM ASIA ETF # ETF: db x-trackers 40,53 $ -1,9 -5,2 57 21,1 26,3 - thes./31.12. 0,65 0≠ LU0292107991<br />
DekaLux Pazifik # Deka Intern. 456,29 € -1,5 -7,3 113 13,2 13,7 25,5 4,56/22.11.10 1,50 5,26 4 LU0052859252<br />
DJE Asian High Dividend P # DJE SA (LU) 142,46 € -0,1 -5,8 81 12,1 - - thes./30.06. 2,26 5 4n LU0374456654<br />
DWS Emerg<strong>in</strong>g Asia # DWS (Lux) 320,90 € -1,7 -5,4 64 15,9 5,2 10,5 thes./31.12. 1,75 5≠ 4 LU0045554143<br />
F&C Asia Pacific Dynamic A # F&C Management 12,70 € -0,9 -5,3 59 9,9 -2,0 - 0,05/03.01.11 2,03 5 LU0235504585<br />
Fidelity ASEAN A $ # Fidelity Investm. (L 29,98 $ -1,7 -6,1 88 37,4 41,8 79,0 0,117/02.08.10 1,98 5,25 2 LU0048573645<br />
Fidelity Asian Aggressive A acc € # Fidelity Investm. (L 10,19 € -1,4 -4,6 43 19,8 - - thes./30.04. 1,94 5,25 LU0345361124<br />
Fidelity Asian Special Situat. A $ # Fidelity Investm. (L 34,33 $ -1,2 -5,2 58 23,6 37,9 59,5 0,123/03.08.09 1,98 5,25 2 LU0054237671<br />
Fidelity Emerg<strong>in</strong>g Asia A Acc € # Fidelity Investm. (L 14,17 € -2,1 -5,2 55 27,9 - - thes./30.04. 1,66 3 LU0329678410<br />
Fidelity South East Asia A $ # Fidelity Investm. (L 7,49 $ -0,9 -2,7 10 27,5 41,5 70,3 0,037/03.08.09 1,96 5,25 2 LU0048597586<br />
First State Asia Pacific A Acc # First State 6,82 £ -1,6 -6,6 101 26,7 32,1 63,1 thes./31.07. - 4 2 GB0030183890<br />
First State Asia Pacific Leaders # First State 3,56 £ -1,8 -6,0 87 25,1 31,6 69,9 thes./31.07. - 4 2 GB0033874214<br />
FORTIS Eq. Best Selection Asia # BNP Paribas 417,54 € -1,4 -4,5 41 19,5 16,2 23,4 thes./31.12. 1,92 5≠ 4 LU0095489554<br />
Frankl<strong>in</strong> Asian FlexCap A acc $ # Frankl<strong>in</strong> Templeton 14,34 $ -1,9 -4,2 34 16,7 28,7 - thes./30.06. 2,00 5,54 LU0260852503<br />
GAM Star Asian Equity € acc # GAM 13,27 € -0,7 -5,5 72 11,4 12,8 - thes./30.06. 1,62 5,26 3n IE00B1D7Z328<br />
Gartmore Asia Pacific € A1 # Gartmore SICAV 9,56 € -2,5 -5,4 67 19,1 21,5 28,1 thes./30.09. - 5 3 LU0200078771<br />
GS Asia Portfolio # Goldman Sachs 20,82 $ -1,9 -5,0 48 22,2 12,7 14,5 0,016/13.12.10 1,90 5,5 4 LU0050126431<br />
Henderson Asian Divid. Income A2 # Henderson Gl. Inv. 15,74 $ -2,0 -7,6 114 13,1 25,1 - thes./30.06. 2,05 5,26 2 LU0264606111<br />
HSBC GIF Asia ex Japan Equity AD # HSBC GIF 55,14 $ -1,1 -4,8 46 26,3 27,9 38,1 0,134/16.07.10 1,84 5,54 3 LU0043850808<br />
HSBC MSCI PACIFIC EX JAPAN ETF ETF: HSBC ETFs PLC 14,02 $ -1,2 -4,8 47 - - - - 0,40 0≠ DE000A1C22P6<br />
Ignis Asia Pacific £ A Acc # Ignis Asset Manageme 1,62 £ -1,3 -4,3 37 20,1 18,9 - thes./31.03. - 5 3 IE00B0S5RK51<br />
ING (L) Asia Pac. High Div # ING (L) INVEST 241,69 € -1,5 -4,0 30 18,1 27,1 - thes./30.09. 1,91 3 2n LU0300631982<br />
ING (L) New Asia P Cap # ING (L) INVEST 1076,58 $ -1,5 -6,4 92 17,3 14,0 28,0 thes./30.09. 1,85 3 3 LU0051129079<br />
Invesco ASEAN Equity A # INVESCO (Irl) 104,53 $ -1,3 -6,4 93 35,2 36,3 54,7 0,85/01.12.09 2,03 5,25 2 IE0003702317<br />
Invesco Asia Infrastructure A € hdg # INVESCO (Lux) 11,70 € -0,3 4,4 2 - - - thes./28.02. - 5,25 LU0482497285<br />
Invesco Asia Infrastructure A thes # INVESCO (Lux) 16,25 $ -1,5 -4,2 35 21,9 10,8 35,7 thes./28.02. 2,01 5,25 LU0243955886<br />
Invesco Asian Equity A # INVESCO (Irl) 6,02 $ -1,8 -5,8 80 24,6 30,4 34,5 0,014/01.02.10 1,92 5,25 2 IE0030381945<br />
Invesco Asia Opportunities Equity A # INVESCO (Lux) 103,82 $ -2,0 -4,1 33 21,2 22,0 44,9 thes./28.02. 2,11 5,25 3 LU0075112721<br />
Investec Asia ex Japan A Acc £ # Investec Select Fund 3,56 £ -1,3 -3,4 20 33,3 34,6 68,0 thes./31.12. 1,61 4,71 2 GB0031141913<br />
iShares MSCI FarEast exJp ETF ETF: Barclays GI (IR 48,24 $ -2,1 -5,2 54 23,1 31,1 44,5 0,055/23.02.11 0,74 0≠ 2 DE000A0HGZS9<br />
ISI Far East Equities # ISI 19,10 € -1,3 -7,0 111 20,0 16,5 30,3 thes./31.12. 1,07 5 4 DK0016259187<br />
JF Asia Alpha Plus A acc USD # JPMorgan A.M. 23,93 $ -1,2 -3,1 13 30,3 37,8 58,6 thes./30.06. 1,90 5≠ 3 LU0169518387<br />
JF Asia Pacific ex-Jap. Eq.A # JPMorgan A.M. 54,96 $ -2,1 -5,2 53 17,6 33,0 37,8 0,31/16.09.10 1,90 5≠ 3 LU0089639594<br />
Jupiter Asia Pacific L $ # Jupiter A.M. 24,01 $ -0,7 -6,4 94 21,3 36,4 61,5 thes./30.09. - 5≠ 2 LU0231116830<br />
Jyske Far Eastern Equity # Jyske Invest Interna 590,35 $ -2,0 -5,7 75 21,3 26,2 43,0 thes./31.12. 1,81 3≠ 3 DK0016260946<br />
KBC Eq. New Asia KAP # KTL Kredietrust 534,99 € -1,5 -5,4 65 15,4 14,7 20,5 thes./31.12. 1,66 5≠ 4 BE0146025409<br />
Legg M. Batt. Asia Pacific A $ a # Legg Mason 230,45 $ -1,2 -6,4 95 20,2 13,2 34,4 - 2,07 5,26 3 IE0034204895<br />
LGT Equity Asia/Pacific ex Japan $ B # LGT Capital Mangem. 2794,06 $ -2,1 -4,7 45 20,8 24,5 34,9 thes./30.04. 1,88 5 3 LI0015327922<br />
LGT Multi Manager Asia ex Jap.$B # LGT Capital Mangem. 2147,16 $ -1,9 -8,1 122 27,0 25,7 37,0 thes./30.11. 2,07 5 2 LI0026536305<br />
LO Pacific Rim P A # Lombard Odier 13,77 $ -2,1 -4,6 42 16,3 1,0 11,1 thes./30.09. 1,99 5 4 LU0052234233<br />
LuxTopic-Pacific P # DJE SA (LU) 20,98 € 0,6 -1,8 4 28,1 19,8 36,4 thes./30.06. 2,06 5 3 LU0188847478<br />
Lyxor ETF MSCI Asia APEX50 A # ETF: Lyxor Internati 63,48 € -2,2 -2,3 8 17,5 - - - 0,50 0≠ FR0010652867<br />
Lyxor ETF MSCI Asia-Pac. exJap. # ETF: Lyxor Internati 34,83 € -1,2 -3,4 21 19,0 19,2 - 0,56/09.06.08 0,65 0≠ FR0010312124<br />
MarketAccess DAXglobal Asia ETF # ETF: MARKET ACCESS 36,19 € -1,7 -4,0 31 22,0 49,6 - thes./31.12. 0,70 0≠ LU0259323235<br />
Mart<strong>in</strong> Currie Asia Pacific $ # Mart<strong>in</strong> Currie GF 11,47 $ -1,9 -6,1 90 18,8 5,3 - - 1,95 5 LU0174482850<br />
Mart<strong>in</strong> Currie Asia Pacific € # Mart<strong>in</strong> Currie GF 10,89 € -1,4 -4,7 44 19,9 8,9 - - 1,95 5 LU0286953574<br />
MFS Meridian Asia Pac. Ex-Jap # MFS 24,62 $ -0,8 -3,6 22 25,1 28,4 30,7 thes./31.01. 2,05 6 2 LU0219441226<br />
M&G Asian Fund A # M&G International 25,84 € -0,9 -4,3 36 25,9 29,8 50,5 thes./31.08. 1,74 5,54 2 GB0030939770<br />
MSMM FUNDS Pacific Bas<strong>in</strong> Eq. # SG Russell AM 2729,60 $ -1,9 -5,8 82 18,5 28,9 31,9 thes./30.09. - 5 3 IE0004308239<br />
MSt. Asian Equity A # Morgan Stanley 45,56 $ -1,5 -5,5 69 20,5 20,7 33,0 thes./31.12. 1,88 6,1 3 LU0073229253<br />
Nestor Fernost # Nestor 75,83 € -1,3 -10,4 131 6,4 26,3 40,7 thes./30.06. 2,27 5≠ 4 LU0054738967<br />
Nevsky Emerg<strong>in</strong>g Asia € thes. # Thames River 9,57 € -2,8 -5,8 83 15,2 28,9 - thes./31.03. - 5≠ IE00B23Y5K77<br />
Newton Oriental € # BNY Mellon A.M. 2,36 € -2,3 -4,1 32 30,0 32,5 48,5 0,005/02.07.09 - 4,17 2 GB0006781396<br />
NGM Asia-Pacific # Nikko Int. 40,71 $ -1,2 -2,8 12 17,8 57,5 64,7 0,22/04.05.99 - 5 3 LU0063291016<br />
Nomura Asia Pacific Nomura AM (D) 105,98 € -1,5 -4,0 27 19,2 10,5 30,5 thes./30.09. 1,76 5 4 DE0008484072<br />
Nordea Far Eastern Value $ # Nordea 21,12 $ -1,8 -5,6 74 19,6 21,0 14,0 thes./31.12. 1,96 5≠ 4 LU0064675985<br />
OP East Asia Oppenheim KAG 116,20 € -1,7 -6,0 85 14,5 7,4 22,8 0,76/17.12.10 1,74 5 4 DE0008486622<br />
Parvest Asia C # BNP Paribas 349,55 $ -2,2 -3,8 25 17,0 7,5 18,0 thes./28.02. - 5≠ 4 LU0111479928<br />
Pictet Asian Eq Ex Japan-P USD # Pictet 190,57 $ -1,9 -6,9 110 13,1 3,9 13,3 thes./30.09. 2,04 5≠ 4 LU0155303323<br />
Pictet Asian Equities (ex Japan) P € # Pictet 132,12 € -1,6 -5,7 78 14,1 3,2 - thes./30.09. 2,04 5≠ LU0255976994<br />
Pictet Pacific ExJapan Index # Pictet 334,56 $ -1,5 -3,1 14 21,3 31,4 42,4 thes./30.09. 0,51 5≠ 3 LU0148538712<br />
Pioneer Pacific exJapan A € ND # Pioneer Investm. 6,61 € -1,5 -6,0 86 12,4 10,8 16,7 thes./31.12. 2,06 5 4 LU0119373065<br />
PPF Far East Asia Opportunities # Alceda Fund Manag. 166,96 $ 2,0 -5,2 56 21,0 - - thes./31.12. - 5≠ LU0426487012<br />
Pr<strong>in</strong>cipal Asian Equity A # Pr<strong>in</strong>cipal C.M. 34,20 $ -1,3 -4,0 29 22,1 21,1 35,5 thes./30.09. - 5,26 4 IE0001148265<br />
SGAM Asia Pac. Dual Strat. A # AMUNDI 12,22 $ -1,2 -5,3 60 16,3 18,4 30,2 thes./31.05. - 5 4 LU0066756973<br />
SISF Asian Equity Yield A thes. # Schroder Invest. 20,82 $ -1,5 -6,5 98 23,6 19,0 22,8 thes./31.12. 2,03 5,26 2 LU0188438112<br />
SISF Pacific Equity A aus. # Schroder Invest. 10,48 $ -1,0 -5,9 84 16,9 37,4 39,7 0,004/21.01.11 2,05 5,26 2 LU0048388663<br />
Skandia Pacific Equity USD # Skandia 3,10 $ -2,0 -6,7 103 23,6 32,9 63,3 thes./31.12. 1,63 5,25 2 IE0005264431<br />
SSgA Emerg<strong>in</strong>g Asia Alpha Eq. I # State Street 549,26 € -1,3 -2,7 11 26,5 24,8 59,0 thes./30.06. 2,00 5,5 2 FR0000027146<br />
Templ. Asian Growth A dis. # Frankl<strong>in</strong> Templeton 34,78 $ -2,2 -3,2 15 34,7 48,5 77,6 0,038/01.07.10 2,27 5,54 2 LU0029875118<br />
Templeton Asian Growth €-hdgd # Frankl<strong>in</strong> Templeton 25,75 € -0,9 4,4 1 34,4 26,9 - thes./30.06. 2,32 5,54 LU0316493583<br />
Templeton Asian Sm. Comp. A acc $ # Frankl<strong>in</strong> Templeton 29,48 $ -1,6 -6,6 102 40,3 - - thes./30.06. 2,32 5,54 2n LU0390135332<br />
Threadneedle Asia AU # Threadneedle (L) 67,47 $ -1,2 -4,5 40 20,6 30,9 35,2 thes./31.03. 2,52 6≠ 3 LU0061477393