English - Human Development Reports - United Nations ...
English - Human Development Reports - United Nations ...
English - Human Development Reports - United Nations ...

You also want an ePaper? Increase the reach of your titles
YUMPU automatically turns print PDFs into web optimized ePapers that Google loves.
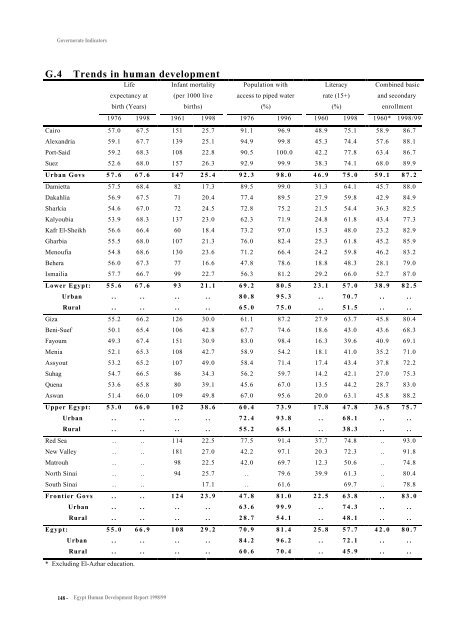
Governorate IndicatorsG.4 Trends in human developmentLife Infant mortality Population with Literacy Combined basicexpectancy at (per 1000 live access to piped water rate (15+) and secondarybirth (Years) births) (%) (%) enrollment1976 1998 1961 1998 1976 1996 1960 1998 1960* 1998/99Cairo 57.0 67.5 151 25.7 91.1 96.9 48.9 75.1 58.9 86.7Alexandria 59.1 67.7 139 25.1 94.9 99.8 45.3 74.4 57.6 88.1Port-Said 59.2 68.3 108 22.8 90.5 100.0 42.2 77.8 63.4 86.7Suez 52.6 68.0 157 26.3 92.9 99.9 38.3 74.1 68.0 89.9Urban Govs 57.6 67.6 147 25.4 92.3 98.0 46.9 75.0 59.1 87.2Damietta 57.5 68.4 82 17.3 89.5 99.0 31.3 64.1 45.7 88.0Dakahlia 56.9 67.5 71 20.4 77.4 89.5 27.9 59.8 42.9 84.9Sharkia 54.6 67.0 72 24.5 72.8 75.2 21.5 54.4 36.3 82.5Kalyoubia 53.9 68.3 137 23.0 62.3 71.9 24.8 61.8 43.4 77.3Kafr El-Sheikh 56.6 66.4 60 18.4 73.2 97.0 15.3 48.0 23.2 82.9Gharbia 55.5 68.0 107 21.3 76.0 82.4 25.3 61.8 45.2 85.9Menoufia 54.8 68.6 130 23.6 71.2 66.4 24.2 59.8 46.2 83.2Behera 56.0 67.3 77 16.6 47.8 78.6 18.8 48.3 28.1 79.0Ismailia 57.7 66.7 99 22.7 56.3 81.2 29.2 66.0 52.7 87.0Lower Egypt: 55.6 67.6 93 21.1 69.2 80.5 23.1 57.0 38.9 82.5Urban .. .. .. .. 80.8 95.3 .. 70.7 .. ..Rural .. .. .. .. 65.0 75.0 .. 51.5 .. ..Giza 55.2 66.2 126 30.0 61.1 87.2 27.9 63.7 45.8 80.4Beni-Suef 50.1 65.4 106 42.8 67.7 74.6 18.6 43.0 43.6 68.3Fayoum 49.3 67.4 151 30.9 83.0 98.4 16.3 39.6 40.9 69.1Menia 52.1 65.3 108 42.7 58.9 54.2 18.1 41.0 35.2 71.0Assyout 53.2 65.2 107 49.0 58.4 71.4 17.4 43.4 37.8 72.2Suhag 54.7 66.5 86 34.3 56.2 59.7 14.2 42.1 27.0 75.3Quena 53.6 65.8 80 39.1 45.6 67.0 13.5 44.2 28.7 83.0Aswan 51.4 66.0 109 49.8 67.0 95.6 20.0 63.1 45.8 88.2Upper Egypt: 53.0 66.0 102 38.6 60.4 73.9 17.8 47.8 36.5 75.7Urban .. .. .. .. 72.4 93.8 .. 68.1 .. ..Rural .. .. .. .. 55.2 65.1 .. 38.3 .. ..Red Sea .. .. 114 22.5 77.5 91.4 37.7 74.8 .. 93.0New Valley .. .. 181 27.0 42.2 97.1 20.3 72.3 .. 91.8Matrouh .. .. 98 22.5 42.0 69.7 12.3 50.6 .. 74.8North Sinai .. .. 94 25.7 .. 79.6 39.9 61.3 .. 80.4South Sinai .. .. 17.1 .. 61.6 69.7 .. 78.8Frontier Govs .. .. 124 23.9 47.8 81.0 22.5 63.8 .. 83.0Urban .. .. .. .. 63.6 99.9 .. 74.3 .. ..Rural .. .. .. .. 28.7 54.1 .. 48.1 .. ..Egypt: 55.0 66.9 108 29.2 70.9 81.4 25.8 57.7 42.0 80.7Urban .. .. .. .. 84.2 96.2 .. 72.1 .. ..Rural .. .. .. .. 60.6 70.4 .. 45.9 .. ..* Excluding El-Azhar education.148 -Egypt <strong>Human</strong> <strong>Development</strong> Report 1998/99