English - Human Development Reports - United Nations ...
English - Human Development Reports - United Nations ...
English - Human Development Reports - United Nations ...

You also want an ePaper? Increase the reach of your titles
YUMPU automatically turns print PDFs into web optimized ePapers that Google loves.
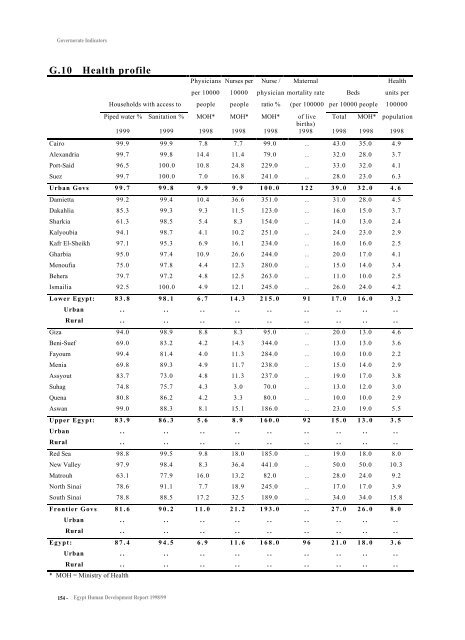
Governorate IndicatorsG.10 Health profilePhysicians Nurses per Nurse / Maternal Healthper 10000 10000 physician mortality rate Beds units perHouseholds with access to people people ratio % (per 100000 per 10000 people 100000Piped water % Sanitation % MOH* MOH* MOH* of live Total MOH* populationbirths)1999 1999 1998 1998 1998 1998 1998 1998 1998Cairo 99.9 99.9 7.8 7.7 99.0 .. 43.0 35.0 4.9Alexandria 99.7 99.8 14.4 11.4 79.0 .. 32.0 28.0 3.7Port-Said 96.5 100.0 10.8 24.8 229.0 .. 33.0 32.0 4.1Suez 99.7 100.0 7.0 16.8 241.0 .. 28.0 23.0 6.3Urban Govs 99.7 99.8 9.9 9.9 100.0 122 39.0 32.0 4.6Damietta 99.2 99.4 10.4 36.6 351.0 .. 31.0 28.0 4.5Dakahlia 85.3 99.3 9.3 11.5 123.0 .. 16.0 15.0 3.7Sharkia 61.3 98.5 5.4 8.3 154.0 .. 14.0 13.0 2.4Kalyoubia 94.1 98.7 4.1 10.2 251.0 .. 24.0 23.0 2.9Kafr El-Sheikh 97.1 95.3 6.9 16.1 234.0 .. 16.0 16.0 2.5Gharbia 95.0 97.4 10.9 26.6 244.0 .. 20.0 17.0 4.1Menoufia 75.0 97.8 4.4 12.3 280.0 .. 15.0 14.0 3.4Behera 79.7 97.2 4.8 12.5 263.0 .. 11.0 10.0 2.5Ismailia 92.5 100.0 4.9 12.1 245.0 .. 26.0 24.0 4.2Lower Egypt: 83.8 98.1 6.7 14.3 215.0 91 17.0 16.0 3.2Urban .. .. .. .. .. .. .. .. ..Rural .. .. .. .. .. .. .. .. ..Giza 94.0 98.9 8.8 8.3 95.0 .. 20.0 13.0 4.6Beni-Suef 69.0 83.2 4.2 14.3 344.0 .. 13.0 13.0 3.6Fayoum 99.4 81.4 4.0 11.3 284.0 .. 10.0 10.0 2.2Menia 69.8 89.3 4.9 11.7 238.0 .. 15.0 14.0 2.9Assyout 83.7 73.0 4.8 11.3 237.0 .. 19.0 17.0 3.8Suhag 74.8 75.7 4.3 3.0 70.0 .. 13.0 12.0 3.0Quena 80.8 86.2 4.2 3.3 80.0 .. 10.0 10.0 2.9Aswan 99.0 88.3 8.1 15.1 186.0 .. 23.0 19.0 5.5Upper Egypt: 83.9 86.3 5.6 8.9 160.0 92 15.0 13.0 3.5Urban .. .. .. .. .. .. .. .. ..Rural .. .. .. .. .. .. .. .. ..Red Sea 98.8 99.5 9.8 18.0 185.0 .. 19.0 18.0 8.0New Valley 97.9 98.4 8.3 36.4 441.0 .. 50.0 50.0 10.3Matrouh 63.1 77.9 16.0 13.2 82.0 .. 28.0 24.0 9.2North Sinai 78.6 91.1 7.7 18.9 245.0 .. 17.0 17.0 3.9South Sinai 78.8 88.5 17.2 32.5 189.0 .. 34.0 34.0 15.8Frontier Govs 81.6 90.2 11.0 21.2 193.0 .. 27.0 26.0 8.0Urban .. .. .. .. .. .. .. .. ..Rural .. .. .. .. .. .. .. .. ..Egypt: 87.4 94.5 6.9 11.6 168.0 96 21.0 18.0 3.6Urban .. .. .. .. .. .. .. .. ..Rural .. .. .. .. .. .. .. .. ..* MOH = Ministry of Health154 -Egypt <strong>Human</strong> <strong>Development</strong> Report 1998/99