English - Human Development Reports - United Nations ...
English - Human Development Reports - United Nations ...
English - Human Development Reports - United Nations ...

You also want an ePaper? Increase the reach of your titles
YUMPU automatically turns print PDFs into web optimized ePapers that Google loves.
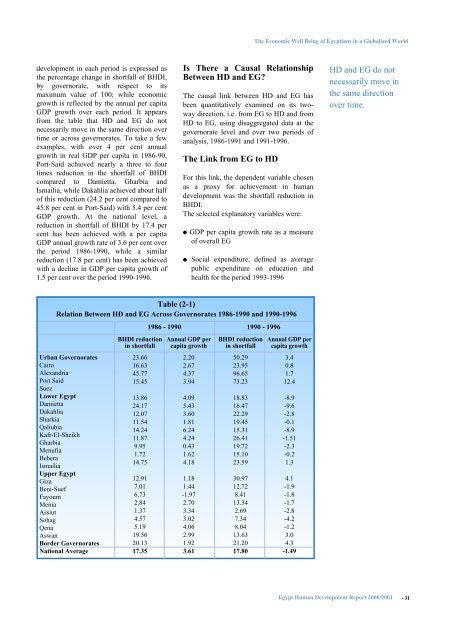
The Economic Well Being of Egyptians in a Globalized Worlddevelopment in each period is expressed asthe percentage change in shortfall of BHDI,by governorate, with respect to itsmaximum value of 100; while economicgrowth is reflected by the annual per capitaGDP growth over each period. It appearsfrom the table that HD and EG do notnecessarily move in the same direction overtime or across governorates. To take a fewexamples, with over 4 per cent annualgrowth in real GDP per capita in 1986-90,Port-Said achieved nearly a three to fourtimes reduction in the shortfall of BHDIcompared to Damietta, Gharbia andIsmailia, while Dakahlia achieved about halfof this reduction (24.2 per cent compared to45.8 per cent in Port-Said) with 5.4 per centGDP growth. At the national level, areduction in shortfall of BHDI by 17.4 percent has been achieved with a per capitaGDP annual growth rate of 3.6 per cent overthe period 1986-1990, while a similarreduction (17.8 per cent) has been achievedwith a decline in GDP per capita growth of1.5 per cent over the period 1990-1996.Is There a Causal RelationshipBetween HD and EG?The causal link between HD and EG hasbeen quantitatively examined on its twowaydirection, i.e. from EG to HD and fromHD to EG, using disaggregated data at thegovernorate level and over two periods ofanalysis, 1986-1991 and 1991-1996.The Link from EG to HDFor this link, the dependent variable chosenas a proxy for achievement in humandevelopment was the shortfall reduction inBHDI.The selected explanatory variables were:● GDP per capita growth rate as a measureof overall EG● Social expenditure, defined as averagepublic expenditure on education andhealth for the period 1993-1996HD and EG do notnecessarily move inthe same directionover time.Table (2-1)Relation Between HD and EG Across Governorates 1986-1990 and 1990-1996Urban GovernoratesCairoAlexandriaPort SaidSuezLower EgyptDamiettaDakahliaSharkiaQaliubiaKafr-El-SheikhGharbiaMenufiaBeheraIsmailiaUpper EgyptGizaBeni-SuefFayoumMeniaAssiutSohagQenaAswanBorder GovernoratesNational AverageBHDI reductionin shortfall23.6616.6345.7715.4513.8624.1712.0711.5414.2411.879.951.7214.7512.917.016.732.841.374.575.1919.5620.1317.351986 - 1990Annual GDP percapita growth2.202.674.373.944.095.433.601.816.244.240.431.624.181.181.44-1.972.703.343.024.062.991.923.61BHDI reductionin shortfall50.2923.9596.6573.2318.8316.4722.2919.4515.3126.4119.7215.1023.5930.9712.728.4113.342.697.348.0413.6321.2017.801990 - 1996Annual GDP percapita growth3.40.81.712.4-8.9-9.6-2.8-0.1-8.9-1.51-2.3-0.21.34.1-1.9-1.8-1.7-2.8-4.2-1.23.04.3-1.49Egypt <strong>Human</strong> <strong>Development</strong> Report 2000/2001 - 31