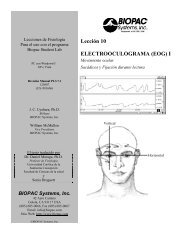
14PsychophysiologyFeaturesAutonomic Nervous SystemStudies Q10Evaluate sympathetic and parasympathetic nervous systemeffects on humans and animals. Record ECG, electrogastrogram(EGG), skin temperature and electrodermalactivity for evidence of sympathetic/parasympatheticnervous system effects. When sympathetic activityincreases, heart rate rises, EGG frequency slows, skintemperature drops and electrodermal activity increases.Evoked ResponsePowerful on- and off-line averaging features make itpossible to perform a wide variety of evoked responsestudies. Record and measure evoked potentials, lateRecord a wide variety of autonomic nervous system functions,including heart rate, skin conductance (also resistance), skintemperature, muscle tension (EMG), neuronal activity(EEG), and eye movement (EOG). Display measurements(e.g., mean value and standard deviation) during or afterdata collection. Perform detailed Event-related Potential(ERP) studies using a variety of different stimulus options,including image presentations, video clips, sound, andsomatosensory stimulation. Combine physiological andpsychological (self-assessment) responses for a detailed study.Use the Equation Generator to enter equations for combiningmultiple physiological variables for automatic assessment, orchoose from an array of preset calculations. Mark events andwrite comments as they occur or after the fact.• Autonomic Nervous System Studies• Evoked Response• Event-related Potential (P300 Tests)• Startle Eye Blink Experiments• Software-controlled Stimulator• Sexual Arousal Studies• Automated Data Analysis• Heart Rate Variability• Automatically Control Other Equipment• Auditory & Visual Evoked Response Testingpotentials, startle, nerve conduction and field potentials.Use the 100C-series biopotential amplifiers to recordvisual, somatosensory and auditory evoked responses.Use the stimulator to output pre-defined waveformsor tones, tone pips, clicks (pulses) or other, morecomplex, waveforms.Event-related Potentials (P300)The STP100W package will present a variety of visualand auditory stimuli on one computer while theAcqKnowledge software records the responses on anothercomputer. As the stimuli are presented, the STP100Wsimultaneously (with 1ms resolution) sends trigger signalsto the <strong>MP</strong> System for data synchronization and collection.The STP100W software (SuperLab) can be used tochange the placement of visual stimuli on the screen,change the screen’s background color, choose froma variety of input and timing options, and providefeedback based on either response or reaction time.Different trigger channels can be paired to different visualor auditory stimuli to perform sophisticated evokedresponse averaging tests (e.g., P300). The off-line averagingfunction in AcqKnowledge displays the averaged responseto each different stimulus triggered from the STP100Wsystem. Useful in other presentation modalities, theTSD200 Pulse Transducer can be attached to a computermonitor to provide event mark timing from a presentationprogram such as PowerPoint ® .
Startle Eye Blink Tests Q11Use the stimulator with the OUT100 headphonesto present auditory stimuli for classic startle responsemeasurements. Use the EMG100C amplifier to recordeye blinks (facial EMG). Use AcqKnowledge to integratethe recorded EMG in real time. Use the measurementtools to determine the startle response and amplitudedirectly, or automate analysis with the peak detectiontools. (See the EMG Application on page 42.)Software-controlled StimulatorThe stimulator provides a variety of pre-formattedoutput options including square, sine and triangle, or userscan design an appropriate stimulus with the graphicalsetup features; stimulus waveforms can be of any polarityand shape. The output options are adjusted eithergraphically or numerically for easy control of amplitude,duration and start time. Users can also output apreviously recorded waveform or create customized stimuliusing the waveform math functions.Sexual Arousal Studies Q12Monitor a variety of different psychophysiological parametersincluding vaginal plethysmography (TCIPPG1),penile plethysmogra p h y(TCI111/TCI112),temperature, GSR,respiration, and pulse.Monitor pulse rate,respiration rate,pulse amplitude, andarea under the pulsecurve on-line withcalculation channels.Use the STP100Wpackage to present a wide range of images while sendingmarker/trigger information to the <strong>MP</strong> System. Use theautomatic analysis features, triggering off of the imagemarkers, to determine the amplitude, duration, and onsettiming of the subject’s response.Automated Data AnalysisThere are a variety of tools for measuring response timesand response amplitudes. Perform measurements manuallyby selecting an area of data, or automatically overspecified time periods or around the time of a trigger(pre- and post-trigger values). Measurement results canbe automatically entered into a journal file for furtheranalysis or displayed as a new graph channel.Heart Rate VariabilityFor Heart Rate Variability studies, record a wide bandwidthECG signal, calculate the R-R interval, and thenapply the FFT or Histogram transformation to the R-Rinterval data. The FFT allows frequency representationusing linear or logarithmic scaling. Users can select froma variety of windowing and display options to easilyreproduce published results.Automatically Control OtherEquipmentThe <strong>MP</strong> System will interface with a wide variety ofdevices such as pumps, valves, stimulators and switches.The <strong>MP</strong> System has 16 digital I/O lines that can bemanually or automatically controlled with theAcqKnowledge software. By using the on-line Calculationand Control channel functions it’s possible toautomatically trigger devices to turn on and off. Use thestimulator and control channels to perform multiplestimulus paradigms. Stimulate the subject based on theresult of a physiological response.Auditory & Visual EvokedResponse TestingCombine the auditory output options of the Stimulatorwith the signal averaging functions of the <strong>MP</strong> System toperform on-line AER studies. Display the results andmeasure the amplitude and time of Fast (2-12 msec),Middle (12-50 msec), Slow (50-300 msec), and Lateresponses (250-600 msec). Use the stroboscope and theaveraging features to perform VER studies. Trigger theaveraging cycle with the stroboscope, or vice-versa.HardwareOptions:15DA100C 54General-purposeTransducer AmplifierTSD120 72Noninvasive BloodPressure CuffTransducerTSD108 70Physiological SoundsMicrophoneBiopotentialAmplifiersECG100C 56EEG100C 56EGG100C 56EOG100C 56ERS100C 56TransducerAmplifiersGSR100C 58PPG100C 58RSP100C 58SKT100C 58TransducersTSD200 81Pulse TransducerTSD201 81Respiration TransducersTSD202Series 82Temperature ProbesTCIPPG1 54Geer InterfaceNIBP100A 68Noninvasive ArterialBlood Pressure MonitorSTM100C 64Stimulator ModuleSTMISOSeries 64Electrical StimulusIsolation AccessoriesOUT100 65HeadphonesTEL100C 66Remote MonitoringModule SetSTP100W 63Stimulus PresentationSystem (SuperLab)TSD122 74StroboscopeEL Series 83ElectrodesLead Series 83Electrode LeadsMEC Series 87Module ExtensionCables