MP Research Catalog - Biopac
MP Research Catalog - Biopac
MP Research Catalog - Biopac
- No tags were found...

You also want an ePaper? Increase the reach of your titles
YUMPU automatically turns print PDFs into web optimized ePapers that Google loves.
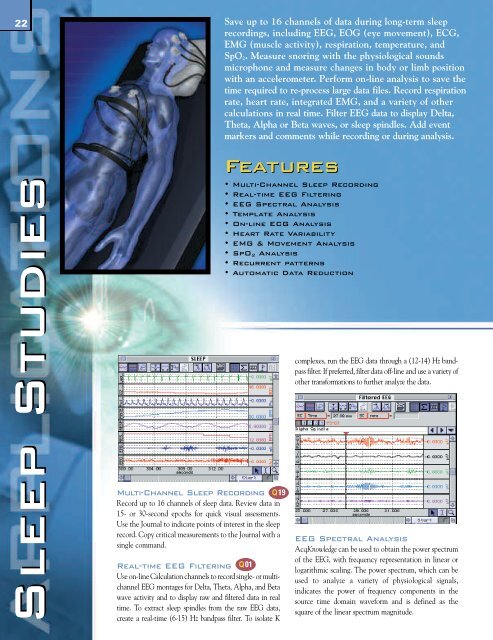
22Sleep StudiesMulti-Channel Sleep Recording Q19Record up to 16 channels of sleep data. Review data in15- or 30-second epochs for quick visual assessments.Use the Journal to indicate points of interest in the sleeprecord. Copy critical measurements to the Journal with asingle command.Real-time EEG Filtering Q01Use on-line Calculation channels to record single- or multichannelEEG montages for Delta, Theta, Alpha, and Betawave activity and to display raw and filtered data in realtime. To extract sleep spindles from the raw EEG data,create a real-time (6-15) Hz bandpass filter. To isolate KSave up to 16 channels of data during long-term sleeprecordings, including EEG, EOG (eye movement), ECG,EMG (muscle activity), respiration, temperature, andSpO 2 . Measure snoring with the physiological soundsmicrophone and measure changes in body or limb positionwith an accelerometer. Perform on-line analysis to save thetime required to re-process large data files. Record respirationrate, heart rate, integrated EMG, and a variety of othercalculations in real time. Filter EEG data to display Delta,Theta, Alpha or Beta waves, or sleep spindles. Add eventmarkers and comments while recording or during analysis.Features• Multi-Channel Sleep Recording• Real-time EEG Filtering• EEG Spectral Analysis• Template Analysis• On-line ECG Analysis• Heart Rate Variability• EMG & Movement Analysis• SpO 2 Analysis• Recurrent patterns• Automatic Data Reductioncomplexes, run the EEG data through a (12-14) Hz bandpassfilter. If preferred, filter data off-line and use a variety ofother transformations to further analyze the data.EEG Spectral AnalysisAcqKnowledge can be used to obtain the power spectrumof the EEG, with frequency representation in linear orlogarithmic scaling. The power spectrum, which can beused to analyze a variety of physiological signals,indicates the power of frequency components in thesource time domain waveform and is defined as thesquare of the linear spectrum magnitude.