- Page 2 and 3: TABLE OF CONTENTS9.4 PS&E DEVELOPME
- Page 4 and 5: TABLE OF CONTENTS9.4 PS&E DEVELOPME
- Page 6 and 7: LIST OF TABLESTablesPage9-1 Design
- Page 8 and 9: 9.1.B. Design Standards.B. Design S
- Page 10 and 11: 9.1.B. Design Standards. (continued
- Page 12 and 13: 9.1.B. Design Standards. (continued
- Page 14 and 15: 9.2 GUIDANCE AND REFERENCESThe publ
- Page 16 and 17: 9.3 INFORMATION GATHERINGThe design
- Page 18 and 19: 9.3.C. Accident Data.C. Accident Da
- Page 20 and 21: 9.4.A. Geometric Design. (continued
- Page 22 and 23: 9.4.A. Geometric Design. (continued
- Page 24: 9.4.A. Geometric Design. (continued
- Page 30 and 31: 9.4.A. Geometric Design. (continued
- Page 33 and 34: 9.4.A. Geometric Design. (continued
- Page 35 and 36: 9.4.A. Geometric Design. (continued
- Page 41: 9.4.A. Geometric Design. (continued
- Page 44: 9.4.A. Geometric Design. (continued
- Page 47: 9.4.A. Geometric Design. (continued
- Page 50 and 51: 9.4.A. Geometric Design. (continued
- Page 54: 9.4.A. Geometric Design. (continued
- Page 61 and 62: 9.4.A. Geometric Design. (continued
- Page 63 and 64: 9.4.A. Geometric Design. (continued
- Page 65 and 66: 9.4.B. Intersection Design. (contin
- Page 67 and 68: 9.4.B. Intersection Design. (contin
- Page 69 and 70: 9.4.B. Intersection Design. (contin
- Page 77 and 78:
9.4.C. Earthwork Design.C. Earthwor
- Page 79 and 80:
9.4.C. Earthwork Design. (continued
- Page 81 and 82:
9.4.C. Earthwork Design. (continued
- Page 83 and 84:
9.4.C. Earthwork Design. (continued
- Page 85 and 86:
9.4.D. Earth Retaining Structures.
- Page 87 and 88:
9.4.D. Earth Retaining Structures.
- Page 89 and 90:
9.4.D. Earth Retaining Structures.
- Page 91 and 92:
9.4.D. Earth Retaining Structures.
- Page 93 and 94:
9.4.D. Earth Retaining Structures.
- Page 95 and 96:
9.4.E. Drainage Design.E. Drainage
- Page 97 and 98:
9.4.E. Drainage Design. (continued)
- Page 99 and 100:
9.4.F. Other Design Elements.F. Oth
- Page 101 and 102:
9.4.F. Other Design Elements. (cont
- Page 103 and 104:
9.4.F. Other Design Elements. (cont
- Page 105 and 106:
9.4.F. Other Design Elements. (cont
- Page 107 and 108:
9.4.F. Other Design Elements. (cont
- Page 109 and 110:
9.4.F. Other Design Elements. (cont
- Page 111 and 112:
9.4.G. Right-of-Way and Utilities.G
- Page 113 and 114:
9.4.G. Right-of-Way and Utilities.
- Page 115 and 116:
9.4.G. Right-of-Way and Utilities.
- Page 117 and 118:
9.4.G. Right-of-Way and Utilities.
- Page 119 and 120:
9.4.G. Right-of-Way and Utilities.
- Page 121 and 122:
9.4.G. Right-of-Way and Utilities.
- Page 123 and 124:
9.4.G. Right-of-Way and Utilities.
- Page 125 and 126:
9.4.G. Right-of-Way and Utilities.
- Page 127 and 128:
9.4.G. Right-of-Way and Utilities.
- Page 129 and 130:
9.4.G. Right-of-Way and Utilities.
- Page 131 and 132:
9.4.G. Right-of-Way and Utilities.
- Page 133 and 134:
9.4.H. Reviews.H. Reviews. PS&E dev
- Page 135 and 136:
9.4.I. Plans.I. Plans. Plans consis
- Page 137 and 138:
9.4.J. Engineer's Estimate.J. Engin
- Page 139 and 140:
9.4.J. Engineer’s Estimate. (cont
- Page 141 and 142:
9.4.J. Engineer’s Estimate. (cont
- Page 143 and 144:
9.4.J. Engineer’s Estimate. (cont
- Page 145 and 146:
9.4.J. Engineer’s Estimate. (cont
- Page 147 and 148:
9.4.J. Engineer’s Estimate. (cont
- Page 149 and 150:
9.4.J. Engineer’s Estimate. (cont
- Page 151 and 152:
9.4.K. Specifications.K. Specificat
- Page 153 and 154:
9.4.K. Specifications. (continued)2
- Page 155 and 156:
9.4.K. Specifications. (continued)W
- Page 157 and 158:
9.4.K. Specifications. (continued)I
- Page 159 and 160:
9.4.L. Contract Assembly.L. Contrac
- Page 161 and 162:
9.6 STANDARD FORMATA. Plans. Projec
- Page 163 and 164:
9.6. Standard Format. (continued)Ta
- Page 165 and 166:
9.6. Standard Format. (continued)A
- Page 167 and 168:
9.6. Standard Format. (continued)Ex
- Page 169 and 170:
9.6. Standard Format. (continued)Sh
- Page 171 and 172:
9.6. Standard Format. (continued)(1
- Page 175 and 176:
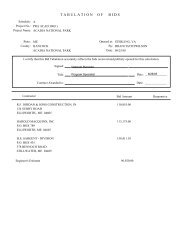
Project Number:Project Name:Descrip
- Page 177 and 178:
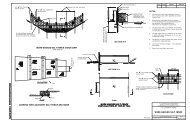
EXHIBIT 9.38APPROVED STANDARD DRAWI
- Page 179 and 180:
EXHIBIT 9.38APPROVED STANDARD DRAWI