- Page 2 and 3:
In situ and Ex situ Conservation of
- Page 4 and 5:
ContentsForeword 1Report of The Int
- Page 6:
Establishment of Meranti Trial Plan
- Page 9 and 10:
2as discussed earlier, dominant for
- Page 14 and 15:
particularly true of those forest s
- Page 16:
In situ Conservation9
- Page 19:
12Background - the world’s forest
- Page 23 and 24:
16Box 2. IUCN Protected Area Catego
- Page 25 and 26:
18to cover the degree to which the
- Page 27 and 28:
20Regional Forest Assessment proces
- Page 29 and 30:
22ecosystem, seldom protect forests
- Page 31 and 32:
24resources, are the key actions ne
- Page 33 and 34:
26Engagement between public and pri
- Page 35 and 36:
28has been made with other storage
- Page 37 and 38:
30The scale of a bioregion will ref
- Page 39 and 40:
32ConclusionsRecent advances in our
- Page 41 and 42:
34Cambridge University Press, Cambr
- Page 43 and 44:
36Ten Kate, K. 1995. Biopiracy or G
- Page 45 and 46:
38IntroductionFor more than 30 year
- Page 47 and 48:
406. Maluku: lowland and montane fo
- Page 49 and 50:
42in national development are consi
- Page 51 and 52:
44focus of these conservation effor
- Page 53 and 54:
46Anticipating a worsening conditio
- Page 55 and 56:
48Forestry official could reach the
- Page 57 and 58:
50moment, Indonesia is preparing a
- Page 60 and 61:
53Status of In Situ Conservation of
- Page 62 and 63:
55Table 2. PRFs by forest types in
- Page 64 and 65:
Table 4. Areas under National Parks
- Page 66 and 67:
Annual Report 1999). The VJRs repre
- Page 68 and 69:
61Seed Production AreasNatural fore
- Page 70 and 71:
appropriate method and time for see
- Page 72 and 73:
65Genetic Resource Area (GRA)As par
- Page 74:
Kendawang (1992) reported that rese
- Page 77 and 78:
70sub-marginal forest (includes the
- Page 79 and 80:
72Table 2. Summary of dipterocarp s
- Page 81 and 82:
74Government policy initiatives and
- Page 83 and 84:
76Seed orchardsThe Ecosystems Resea
- Page 85 and 86:
78In situ conservationThis conserva
- Page 87 and 88:
80biodiversity conservation measure
- Page 89 and 90:
82Bureau of Forest Development. 197
- Page 91 and 92:
84losses of forestlands in Thailand
- Page 93 and 94:
86In Situ Conservation of Forest Ge
- Page 95 and 96:
88- relative humidity = 85.8 %Site
- Page 97 and 98:
90A species area curve index was co
- Page 99 and 100:
92The ecologically- important tree
- Page 101 and 102:
94Table 3 Dominant tree species in
- Page 104 and 105:
97Table 6 Dominant tree species in
- Page 106 and 107:
frequency, and basal area of each s
- Page 108 and 109:
101Conserving Tropical Forests:Braz
- Page 110 and 111:
103With approximately US$340 millio
- Page 112 and 113:
105Demonstration Projects (PD/A)Obj
- Page 114 and 115:
107• Stimulate subprojects to ana
- Page 116 and 117:
109in close partnership with severa
- Page 118 and 119:
111Current StatusThe completion of
- Page 120 and 121:
113Rain Forest Corridors ProjectThe
- Page 122 and 123:
115However, they should be more str
- Page 124 and 125:
117RFT for MMA to cover a six-month
- Page 126 and 127:
119Projects and ComponentsThe subpr
- Page 128 and 129:
121established pre-conditions (sele
- Page 130 and 131:
123Sub-program), indicating the adv
- Page 132 and 133:
Ex situ Conservation125
- Page 134 and 135:
Ex situ Conservation of Commercial
- Page 136 and 137:
Table 1.General advantages and disa
- Page 138 and 139:
131It is a resource because it poss
- Page 140 and 141:
133• The trees reproduce themselv
- Page 142 and 143:
135species. This is obviously a ser
- Page 144 and 145:
137between species. Loss of genetic
- Page 146 and 147:
139Figure 1. Conceptual presentatio
- Page 148 and 149:
141basis for future domestication o
- Page 150 and 151:
143must also be considered.• If t
- Page 152 and 153:
145FSIV, 1996. List of native Vietn
- Page 154 and 155:
147The Status of Ex Situ Conservati
- Page 156 and 157:
149therefore, conservation of some
- Page 158 and 159:
151The specific objectives of the p
- Page 160 and 161:
153most important step in tree intr
- Page 162 and 163:
155in 1932, the large-scale tree im
- Page 164 and 165:
157the samples depend on the breedi
- Page 166 and 167:
159Site selectionIn selecting sites
- Page 168 and 169:
161The Status of ex situ Conservati
- Page 170 and 171:
163establishment of a system of nat
- Page 172 and 173:
165After a while, all these plantin
- Page 174 and 175:
167planting activities were not ini
- Page 176 and 177:
1691993. pp: 72-77.Moura-Costa, P.
- Page 178 and 179:
171The Status of In situ and Ex sit
- Page 180 and 181:
173conducted, particularly on roote
- Page 182 and 183:
175Table 1. D. alatus plantation ar
- Page 184 and 185:
177Plantation of D. alatus by priva
- Page 186 and 187:
179Many attempts have been made to
- Page 188 and 189:
181ConclusionThe total area of D. a
- Page 190 and 191:
183Ex situ Conservation of Dipteroc
- Page 192 and 193:
185Figure 1. Location of FNCRDC dem
- Page 194 and 195:
187A total of 41 species of diptero
- Page 196 and 197:
189FNCRDC); forest protection (held
- Page 198 and 199:
Appendix 1. Dipterocarps collection
- Page 200 and 201:
193Practical Experience with Ex sit
- Page 202 and 203:
195The Ex situ Programme on Tropica
- Page 204 and 205:
197Isolation from contaminating pol
- Page 206 and 207:
199clear where dead trees were loca
- Page 208 and 209:
201What is the Conservation Value o
- Page 210 and 211:
2031/2 to 1/3 of the original numbe
- Page 212 and 213:
205Faulkner, R. 1975. Seed Orchards
- Page 214 and 215:
207Genetical Studies for Conservati
- Page 216 and 217:
209mating or reproductive system, o
- Page 218 and 219:
211collections of several natural p
- Page 220 and 221:
Genetic Conservation to ServeBreedi
- Page 222 and 223:
215Genetic Conservation in AppliedT
- Page 224 and 225:
Population size and the conservatio
- Page 226 and 227:
219One needs to start with large nu
- Page 228 and 229:
221very little resistance is eviden
- Page 230 and 231:
223Maintenance of genetic diversity
- Page 232 and 233:
225used to establish a gene resourc
- Page 234 and 235:
227Selection and mating proceduresG
- Page 236 and 237:
229Systematics and Evolutionary Bio
- Page 238 and 239:
231Current Status of Tree Improveme
- Page 240 and 241:
233(1) determine genetic variation
- Page 242 and 243:
235Production Forests, Large-Scale
- Page 244 and 245:
237Genetic Tree ImprovementActiviti
- Page 246 and 247:
239SpeciesBased on species/group of
- Page 248 and 249:
241of progeny tests, clone banks, c
- Page 250 and 251:
243First Generation Breeding Strate
- Page 252 and 253:
245Table 5. Individual and Family H
- Page 254 and 255:
247full-sib mating (single or doubl
- Page 256 and 257:
Table 8. Tree Growth Performance of
- Page 258 and 259:
251Eucalyptus urophylla (Ampupu)Amp
- Page 260 and 261:
253in traditional medicine. The bar
- Page 262 and 263:
255Education, TrainingTraining is a
- Page 264 and 265:
257The Faculty of Forestry, Gadjah
- Page 266 and 267:
259Prospect and ProgressForest tree
- Page 268 and 269:
261to Indonesia, June 29 to July 9.
- Page 270 and 271:
263Ex situ Conservation of Pinus me
- Page 272 and 273:
265and Kerinci populations were 0.2
- Page 274 and 275:
267per subpopulation has been recom
- Page 276 and 277:
269Eriksson, G; Namkoong. G. & Robe
- Page 278 and 279:
271The Benefits of Tree Improvement
- Page 280 and 281:
273forest of Thailand in 1994 (Dona
- Page 282 and 283:
275σ 2 F(P)Family heritability ( h
- Page 284 and 285:
277Financial ParametersPlanting obj
- Page 286 and 287:
279Tree improvement costs include a
- Page 288 and 289:
281inbreeding. There is improved ga
- Page 290 and 291:
283that one is often faced in an ap
- Page 292 and 293:
285In order to quantify the effecti
- Page 294 and 295:
287Suitable Tropical Hardwoods from
- Page 296 and 297:
Ex Situ Genetic Conservation of Aca
- Page 298 and 299:
291can neither rely solely upon see
- Page 300 and 301:
293Infusions of fresh genetic mater
- Page 302 and 303:
295Potential for Combining a Tree I
- Page 304 and 305:
297Progeny Trial And Conservation B
- Page 306 and 307:
299Molecular Approaches to Conservi
- Page 308 and 309:
301dispersal within populations. Mi
- Page 310 and 311:
303The outcrossing rate varied grea
- Page 312 and 313:
305and some dipterocarpous species
- Page 314 and 315:
307regions in chloroplast DNA. TROP
- Page 316 and 317:
309Genetic Structure of Natural Pop
- Page 318 and 319:
311Kapur is one of several local sp
- Page 320 and 321:
313Table 1. Microsatellite loci all
- Page 322 and 323:
315Table 3. Fixation index (F) in t
- Page 324 and 325:
317and Ulu Sedili was low, that is
- Page 326 and 327:
319ratios that deviated from Hardy-
- Page 328 and 329:
321Genetic differentiation and gene
- Page 330 and 331: 323morphological and physiological
- Page 332 and 333: A Study of Genetic Variation Using
- Page 334 and 335: 327CAG, E-AAC/M-CTG, where E and M
- Page 336 and 337: 329Figure 1.KiireTanegashimaKumejim
- Page 338 and 339: 331Genetic Structure of Shorea lepr
- Page 340 and 341: 333Microsatellite markersFour micro
- Page 342 and 343: 335Table 2. Genetic diversity based
- Page 344 and 345: 337Sampling strategyThe objective o
- Page 346 and 347: 339Genetic Variation of Lophopetalu
- Page 348 and 349: 341Enzyme extractionPolyacrylamide
- Page 350 and 351: 343clear band observed. These resul
- Page 352 and 353: 345S17, S20, S29, S37, S62, S64, S7
- Page 354 and 355: 347Guiana tropical forest. American
- Page 356 and 357: Evaluating Genetic Diversity of Dip
- Page 358 and 359: 351Isoenzyme AnalysisEmbryos were e
- Page 360 and 361: 353Table 4. Matrix of Nei (1978) un
- Page 362 and 363: 355Genetic Markers for Assessing Ge
- Page 364 and 365: 357determining mating systems and p
- Page 366 and 367: 359Eusideroxylon zwagerii, locally
- Page 368 and 369: Results361and maintained at 4 o C.
- Page 370 and 371: 363manan indicated that there were
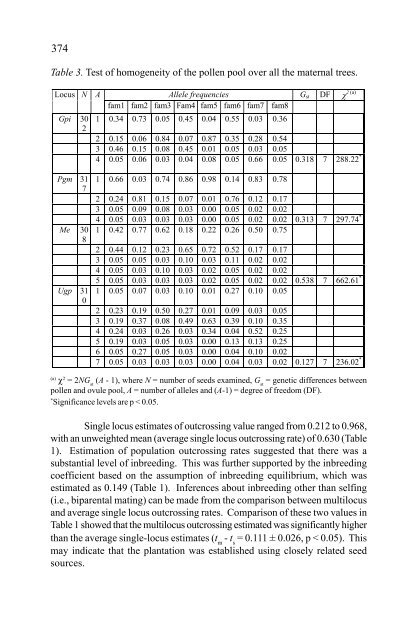
- Page 372 and 373: 365apparently not encountered. The
- Page 374 and 375: 367and one site of Silvagama in Kua
- Page 376 and 377: 369Mating System Parameters of Dryo
- Page 378 and 379: 371Materials and MethodsSamplingThi
- Page 382 and 383: 375In conclusion, D. oblongifolia p
- Page 384 and 385: Estimation of Genetic Variation of
- Page 386 and 387: 379RAPD analysisTwenty-six arbitrar
- Page 388 and 389: 381Figure 1. Allele frequency of fo
- Page 390 and 391: 383The genetic diversity (mean expe
- Page 392 and 393: Forest Plantation385
- Page 394 and 395: Commercial Plantation Strategy to R
- Page 396 and 397: 389The forests in the continental r
- Page 398 and 399: 391Table 5.Area of natural forest a
- Page 400 and 401: 393Besides damage to vegetation, th
- Page 402 and 403: 395services and biodiversity, may n
- Page 404 and 405: 397forest and agriculture on the sa
- Page 406 and 407: 399If forest reserves are ever to p
- Page 408 and 409: 401d. Inadequate Supply of Quality
- Page 410 and 411: 403Conclusion - The Way ForwardGive
- Page 412 and 413: 405Dipterocarp Plantation:the Strat
- Page 414 and 415: 407Seed (whenever available, mostly
- Page 416 and 417: 409Gmelina arborea. Current activit
- Page 418 and 419: 411Planting Meranti (Shorea sp.) Tr
- Page 420 and 421: 413the replanting areas are signifi
- Page 422 and 423: 415As a comparison, the following d
- Page 424 and 425: 417with natural replanting. Also, o
- Page 426 and 427: 419Establishment of Meranti Trial P
- Page 428 and 429: 421and 3 (seedlings only for 4 x 4
- Page 430 and 431:
423Overall, growth and survival of
- Page 432 and 433:
425Shorea leprosula and S. selanica
- Page 434 and 435:
427Potential of Carbon Sequestratio
- Page 436 and 437:
429significant portion of the world
- Page 438 and 439:
431(Page et al. 1982). Soil organic
- Page 440 and 441:
433Table 3. Mean soil organic carbo
- Page 442 and 443:
435this study suggests that the val
- Page 444 and 445:
437McNeely, J.A., Miller, K.R., Rei
- Page 446 and 447:
Possibility of Timber Estate Develo
- Page 448 and 449:
441three weeks prior to transplanti
- Page 450 and 451:
443Table 3. Effects of endomycorrhi
- Page 452 and 453:
445Biological properties of the soi
- Page 454 and 455:
447ReferencesGrandt, A.F, 1988. Pro
- Page 456 and 457:
449Strengthening Tree Farming Activ
- Page 458 and 459:
451On Farm Tree Cultivation - Genet
- Page 460 and 461:
453Table 1. Species identified by I
- Page 462 and 463:
455seed available from national or
- Page 464 and 465:
Miscellaneous(Posters and Voluntary
- Page 466 and 467:
459Conservation of Soil Microbial D
- Page 468 and 469:
461preliminary study using an unive
- Page 470 and 471:
463Nevertheless, inability to form
- Page 472 and 473:
465Box 1Structure of vegetation and
- Page 474 and 475:
467Nucleic Acid Based-methodsThe th
- Page 476 and 477:
469sequences. DGGE and TGGE detect
- Page 478 and 479:
471What is the meaning of diversity
- Page 480 and 481:
473Sharing the OutcomesData collect
- Page 482 and 483:
475Evidence of interest in internat
- Page 484 and 485:
477the entire ecosystem, including
- Page 486 and 487:
479Lie, A.T., Goktan, D., Engin, M.
- Page 488 and 489:
481Additional Activities to Ex situ
- Page 490 and 491:
483Results and DiscussionA hundred
- Page 492 and 493:
485Figure 3. Root nodules formed by
- Page 494 and 495:
Figure 5. Interaction between prove
- Page 496 and 497:
489Suggestion and Future Plan1. Due
- Page 498 and 499:
491Mycorrhizal Fungal Population in
- Page 500 and 501:
493including polyphosphate, glycoge
- Page 502 and 503:
495Honrubia (1997). By following fr
- Page 504 and 505:
497Similar to the pattern found for
- Page 506 and 507:
Figure 3. Arbuscules (arrow) formed
- Page 508 and 509:
501109-152. Pergamon Press, Oxford.
- Page 510 and 511:
503Population Genetic Study of Shor
- Page 512 and 513:
505screening. Finally, 16 primers w
- Page 514 and 515:
507DiscussionThe genetic diversity
- Page 516 and 517:
Study on Reproductive Phenology of
- Page 518 and 519:
511Considering the difficulty of E.
- Page 520 and 521:
513Table 1. Developmental phase of
- Page 522 and 523:
5152g 2h 2i2j2kEach single flower c
- Page 524 and 525:
517During 65 days of enlargement pr
- Page 526 and 527:
519Figure 6. The value of Fruit/Flo
- Page 528 and 529:
521temperature stimulated floral in
- Page 530 and 531:
5231989). Such foraging behavior al
- Page 532 and 533:
Revolving Cutting Technique (RCT) f
- Page 534 and 535:
527Results and DiscussionRooting pe
- Page 536 and 537:
Evaluation of a Progeny Test of Euc
- Page 538 and 539:
531These h 2 estimates ranged from
- Page 540 and 541:
533Notes:*) Means with some letter
- Page 542 and 543:
535Plantations in Experimental Fore
- Page 544 and 545:
537Ex situ Conservation in Experime
- Page 546 and 547:
539Table 1. Growth of six dipteroca
- Page 548 and 549:
541faced by FORIS. Illegal tree cut
- Page 550 and 551:
543Plantation Forests in East Kalim
- Page 552 and 553:
545of protected forestlands, includ
- Page 554 and 555:
547from Tanjung Redeb Hutani shows
- Page 556 and 557:
549• The establishment of planted
- Page 558 and 559:
551In Situ Conservation of Ebony(Di
- Page 560 and 561:
553Ebony CharacteristicsEbony is a
- Page 562 and 563:
5554. The Rubiaceae family was the
- Page 564 and 565:
557Figure 7. Shallow Soil Layer of
- Page 566 and 567:
Appendix559
- Page 568 and 569:
International Conference onex situ
- Page 570 and 571:
563Suchitra ChangtragoonRoyal Fores
- Page 572 and 573:
Endang SuhendangEnny SudarmonowatiS
- Page 574 and 575:
567PriyatnaPuslit BPTHPhone: 0274-8
- Page 576 and 577:
569Untung IskandarVivi YuskiantiBap
- Page 578:
571Project Executing Agency (PEA)Fa


![[ID]Peta Jalan Menuju Pengelolaan Ramin - ITTO](https://img.yumpu.com/49466232/1/184x260/idpeta-jalan-menuju-pengelolaan-ramin-itto.jpg?quality=85)
![[ID]Review and Measures to Improve Its Implementation - ITTO](https://img.yumpu.com/49270549/1/184x260/idreview-and-measures-to-improve-its-implementation-itto.jpg?quality=85)