The Executive Compensation Controversy - Fondazione Rodolfo ...
The Executive Compensation Controversy - Fondazione Rodolfo ...
The Executive Compensation Controversy - Fondazione Rodolfo ...

Create successful ePaper yourself
Turn your PDF publications into a flip-book with our unique Google optimized e-Paper software.
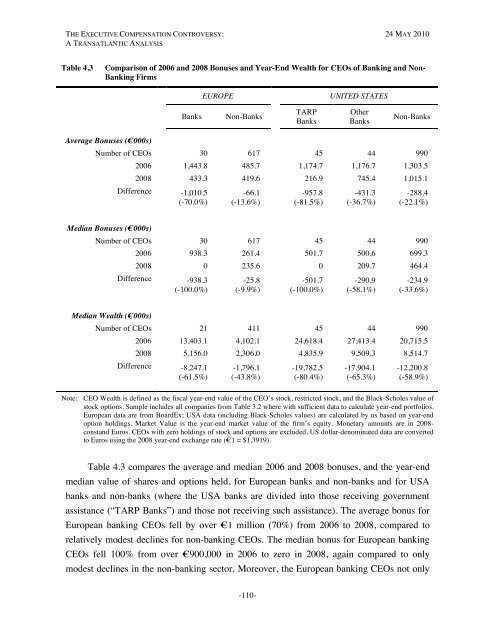
THE EXECUTIVE COMPENSATION CONTROVERSY: 24 MAY 2010A TRANSATLANTIC ANALYSISTable 4.3Comparison of 2006 and 2008 Bonuses and Year-End Wealth for CEOs of Banking and Non-Banking FirmsEUROPEUNITED STATESBanksNon-BanksTARPBanksOtherBanksNon-BanksAverage Bonuses (€000s)Number of CEOs 30 617 45 44 9902006 1,443.8 485.7 1,174.7 1,176.7 1,303.52008 433.3 419.6 216.9 745.4 1,015.1Difference -1,010.5 -66.1 -957.8 -431.3 -288.4(-70.0%) (-13.6%) (-81.5%) (-36.7%) (-22.1%)Median Bonuses (€000s)Number of CEOs 30 617 45 44 9902006 938.3 261.4 501.7 500.6 699.32008 0 235.6 0 209.7 464.4Difference -938.3 -25.8 -501.7 -290.9 -234.9(-100.0%) (-9.9%) (-100.0%) (-58.1%) (-33.6%)Median Wealth (€000s)Number of CEOs 21 411 45 44 9902006 13,403.1 4,102.1 24,618.4 27,413.4 20,715.52008 5,156.0 2,306.0 4,835.9 9,509.3 8,514.7Difference -8,247.1 -1,796.1 -19,782.5 -17,904.1 -12,200.8(-61.5%) (-43.8%) (-80.4%) (-65.3%) (-58.9%)Note: CEO Wealth is defined as the fiscal year-end value of the CEO’s stock, restricted stock, and the Black-Scholes value ofstock options. Sample includes all companies from Table 3.2 where with sufficient data to calculate year-end portfolios.European data are from BoardEx; USA data (including Black-Scholes values) are calculated by us based on year-endoption holdings. Market Value is the year-end market value of the firm’s equity. Monetary amounts are in 2008-constand Euros. CEOs with zero holdings of stock and options are excluded. US dollar-denominated data are convertedto Euros using the 2008 year-end exchange rate (€1 = $1.3919).Table 4.3 compares the average and median 2006 and 2008 bonuses, and the year-endmedian value of shares and options held, for European banks and non-banks and for USAbanks and non-banks (where the USA banks are divided into those receiving governmentassistance (“TARP Banks”) and those not receiving such assistance). <strong>The</strong> average bonus forEuropean banking CEOs fell by over €1 million (70%) from 2006 to 2008, compared torelatively modest declines for non-banking CEOs. <strong>The</strong> median bonus for European bankingCEOs fell 100% from over €900,000 in 2006 to zero in 2008, again compared to onlymodest declines in the non-banking sector. Moreover, the European banking CEOs not only-110-