The Executive Compensation Controversy - Fondazione Rodolfo ...
The Executive Compensation Controversy - Fondazione Rodolfo ...
The Executive Compensation Controversy - Fondazione Rodolfo ...

Create successful ePaper yourself
Turn your PDF publications into a flip-book with our unique Google optimized e-Paper software.
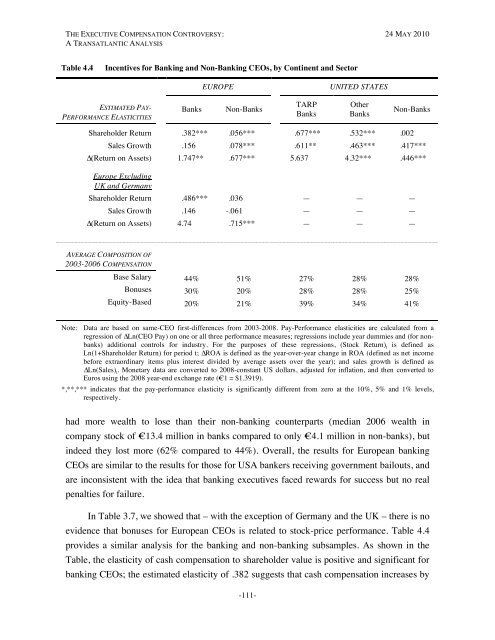
THE EXECUTIVE COMPENSATION CONTROVERSY: 24 MAY 2010A TRANSATLANTIC ANALYSISTable 4.4Incentives for Banking and Non-Banking CEOs, by Continent and SectorEUROPEUNITED STATESESTIMATED PAY-PERFORMANCE ELASTICITIESBanksNon-BanksTARPBanksOtherBanksNon-BanksShareholder Return .382*** .056*** .677*** .532*** .002Sales Growth .156 .078*** .611** .463*** .417***∆(Return on Assets) 1.747** .677*** 5.637 4.32*** .446***Europe ExcludingUK and GermanyShareholder Return .486*** .036 — — —Sales Growth .146 -.061 — — —∆(Return on Assets) 4.74 .715*** — — —AVERAGE COMPOSITION OF2003-2006 COMPENSATIONBase Salary 44% 51% 27% 28% 28%Bonuses 30% 20% 28% 28% 25%Equity-Based 20% 21% 39% 34% 41%Note: Data are based on same-CEO first-differences from 2003-2008. Pay-Performance elasticities are calculated from aregression of ∆Ln(CEO Pay) on one or all three performance measures; regressions include year dummies and (for nonbanks)additional controls for industry. For the purposes of these regressions, (Stock Return) t is defined asLn(1+Shareholder Return) for period t; ∆ROA is defined as the year-over-year change in ROA (defined as net incomebefore extraordinary items plus interest divided by average assets over the year); and sales growth is defined as∆Ln(Sales) t . Monetary data are converted to 2008-constant US dollars, adjusted for inflation, and then converted toEuros using the 2008 year-end exchange rate (€1 = $1.3919).*,**,*** indicates that the pay-performance elasticity is significantly different from zero at the 10%, 5% and 1% levels,respectively.had more wealth to lose than their non-banking counterparts (median 2006 wealth incompany stock of €13.4 million in banks compared to only €4.1 million in non-banks), butindeed they lost more (62% compared to 44%). Overall, the results for European bankingCEOs are similar to the results for those for USA bankers receiving government bailouts, andare inconsistent with the idea that banking executives faced rewards for success but no realpenalties for failure.In Table 3.7, we showed that – with the exception of Germany and the UK – there is noevidence that bonuses for European CEOs is related to stock-price performance. Table 4.4provides a similar analysis for the banking and non-banking subsamples. As shown in theTable, the elasticity of cash compensation to shareholder value is positive and significant forbanking CEOs; the estimated elasticity of .382 suggests that cash compensation increases by-111-