The Executive Compensation Controversy - Fondazione Rodolfo ...
The Executive Compensation Controversy - Fondazione Rodolfo ...
The Executive Compensation Controversy - Fondazione Rodolfo ...

You also want an ePaper? Increase the reach of your titles
YUMPU automatically turns print PDFs into web optimized ePapers that Google loves.
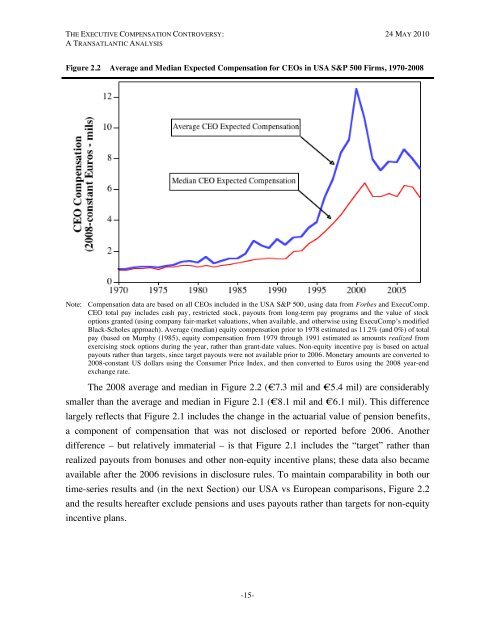
THE EXECUTIVE COMPENSATION CONTROVERSY: 24 MAY 2010A TRANSATLANTIC ANALYSISFigure 2.2 Average and Median Expected <strong>Compensation</strong> for CEOs in USA S&P 500 Firms, 1970-2008Note: <strong>Compensation</strong> data are based on all CEOs included in the USA S&P 500, using data from Forbes and ExecuComp.CEO total pay includes cash pay, restricted stock, payouts from long-term pay programs and the value of stockoptions granted (using company fair-market valuations, when available, and otherwise using ExecuComp’s modifiedBlack-Scholes approach). Average (median) equity compensation prior to 1978 estimated as 11.2% (and 0%) of totalpay (based on Murphy (1985), equity compensation from 1979 through 1991 estimated as amounts realized fromexercising stock options during the year, rather than grant-date values. Non-equity incentive pay is based on actualpayouts rather than targets, since target payouts were not available prior to 2006. Monetary amounts are converted to2008-constant US dollars using the Consumer Price Index, and then converted to Euros using the 2008 year-endexchange rate.<strong>The</strong> 2008 average and median in Figure 2.2 (€7.3 mil and €5.4 mil) are considerablysmaller than the average and median in Figure 2.1 (€8.1 mil and €6.1 mil). This differencelargely reflects that Figure 2.1 includes the change in the actuarial value of pension benefits,a component of compensation that was not disclosed or reported before 2006. Anotherdifference – but relatively immaterial – is that Figure 2.1 includes the “target” rather thanrealized payouts from bonuses and other non-equity incentive plans; these data also becameavailable after the 2006 revisions in disclosure rules. To maintain comparability in both ourtime-series results and (in the next Section) our USA vs European comparisons, Figure 2.2and the results hereafter exclude pensions and uses payouts rather than targets for non-equityincentive plans.-15-