The Executive Compensation Controversy - Fondazione Rodolfo ...
The Executive Compensation Controversy - Fondazione Rodolfo ...
The Executive Compensation Controversy - Fondazione Rodolfo ...

Create successful ePaper yourself
Turn your PDF publications into a flip-book with our unique Google optimized e-Paper software.
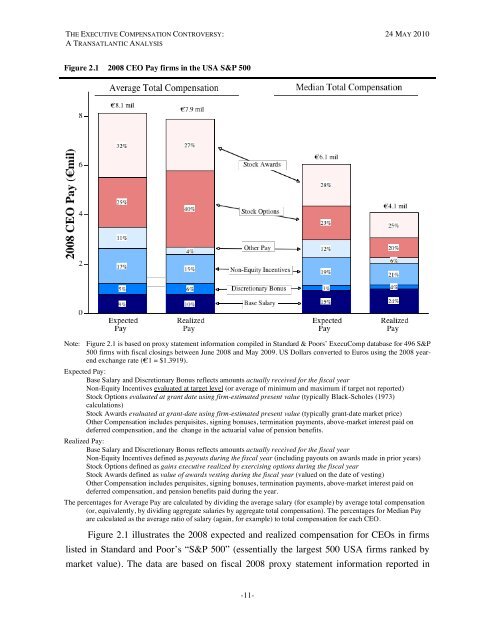
THE EXECUTIVE COMPENSATION CONTROVERSY: 24 MAY 2010A TRANSATLANTIC ANALYSISFigure 2.1 2008 CEO Pay firms in the USA S&P 500Note: Figure 2.1 is based on proxy statement information compiled in Standard & Poors’ ExecuComp database for 496 S&P500 firms with fiscal closings between June 2008 and May 2009. US Dollars converted to Euros using the 2008 yearendexchange rate (€1 = $1.3919).Expected Pay:Base Salary and Discretionary Bonus reflects amounts actually received for the fiscal yearNon-Equity Incentives evaluated at target level (or average of minimum and maximum if target not reported)Stock Options evaluated at grant date using firm-estimated present value (typically Black-Scholes (1973)calculations)Stock Awards evaluated at grant-date using firm-estimated present value (typically grant-date market price)Other <strong>Compensation</strong> includes perquisites, signing bonuses, termination payments, above-market interest paid ondeferred compensation, and the change in the actuarial value of pension benefits.Realized Pay:Base Salary and Discretionary Bonus reflects amounts actually received for the fiscal yearNon-Equity Incentives defined as payouts during the fiscal year (including payouts on awards made in prior years)Stock Options defined as gains executive realized by exercising options during the fiscal yearStock Awards defined as value of awards vesting during the fiscal year (valued on the date of vesting)Other <strong>Compensation</strong> includes perquisites, signing bonuses, termination payments, above-market interest paid ondeferred compensation, and pension benefits paid during the year.<strong>The</strong> percentages for Average Pay are calculated by dividing the average salary (for example) by average total compensation(or, equivalently, by dividing aggregate salaries by aggregate total compensation). <strong>The</strong> percentages for Median Payare calculated as the average ratio of salary (again, for example) to total compensation for each CEO.Figure 2.1 illustrates the 2008 expected and realized compensation for CEOs in firmslisted in Standard and Poor’s “S&P 500” (essentially the largest 500 USA firms ranked bymarket value). <strong>The</strong> data are based on fiscal 2008 proxy statement information reported in-11-