The Executive Compensation Controversy - Fondazione Rodolfo ...
The Executive Compensation Controversy - Fondazione Rodolfo ...
The Executive Compensation Controversy - Fondazione Rodolfo ...
You also want an ePaper? Increase the reach of your titles
YUMPU automatically turns print PDFs into web optimized ePapers that Google loves.
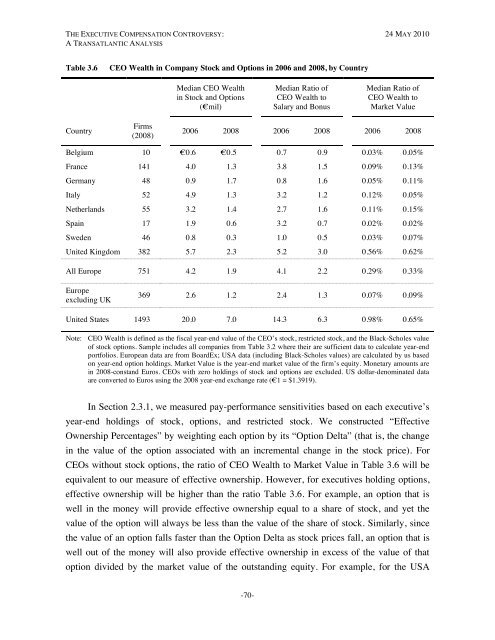
THE EXECUTIVE COMPENSATION CONTROVERSY: 24 MAY 2010A TRANSATLANTIC ANALYSISTable 3.6CEO Wealth in Company Stock and Options in 2006 and 2008, by CountryMedian CEO Wealthin Stock and Options(€mil)Median Ratio ofCEO Wealth toSalary and BonusMedian Ratio ofCEO Wealth toMarket ValueCountryFirms(2008)2006 2008 2006 2008 2006 2008Belgium 10 €0.6 €0.5 0.7 0.9 0.03% 0.05%France 141 4.0 1.3 3.8 1.5 0.09% 0.13%Germany 48 0.9 1.7 0.8 1.6 0.05% 0.11%Italy 52 4.9 1.3 3.2 1.2 0.12% 0.05%Netherlands 55 3.2 1.4 2.7 1.6 0.11% 0.15%Spain 17 1.9 0.6 3.2 0.7 0.02% 0.02%Sweden 46 0.8 0.3 1.0 0.5 0.03% 0.07%United Kingdom 382 5.7 2.3 5.2 3.0 0.56% 0.62%All Europe 751 4.2 1.9 4.1 2.2 0.29% 0.33%Europeexcluding UK369 2.6 1.2 2.4 1.3 0.07% 0.09%United States 1493 20.0 7.0 14.3 6.3 0.98% 0.65%Note: CEO Wealth is defined as the fiscal year-end value of the CEO’s stock, restricted stock, and the Black-Scholes valueof stock options. Sample includes all companies from Table 3.2 where their are sufficient data to calculate year-endportfolios. European data are from BoardEx; USA data (including Black-Scholes values) are calculated by us basedon year-end option holdings. Market Value is the year-end market value of the firm’s equity. Monetary amounts arein 2008-constand Euros. CEOs with zero holdings of stock and options are excluded. US dollar-denominated dataare converted to Euros using the 2008 year-end exchange rate (€1 = $1.3919).In Section 2.3.1, we measured pay-performance sensitivities based on each executive’syear-end holdings of stock, options, and restricted stock. We constructed “EffectiveOwnership Percentages” by weighting each option by its “Option Delta” (that is, the changein the value of the option associated with an incremental change in the stock price). ForCEOs without stock options, the ratio of CEO Wealth to Market Value in Table 3.6 will beequivalent to our measure of effective ownership. However, for executives holding options,effective ownership will be higher than the ratio Table 3.6. For example, an option that iswell in the money will provide effective ownership equal to a share of stock, and yet thevalue of the option will always be less than the value of the share of stock. Similarly, sincethe value of an option falls faster than the Option Delta as stock prices fall, an option that iswell out of the money will also provide effective ownership in excess of the value of thatoption divided by the market value of the outstanding equity. For example, for the USA-70-


