The Executive Compensation Controversy - Fondazione Rodolfo ...
The Executive Compensation Controversy - Fondazione Rodolfo ...
The Executive Compensation Controversy - Fondazione Rodolfo ...

Create successful ePaper yourself
Turn your PDF publications into a flip-book with our unique Google optimized e-Paper software.
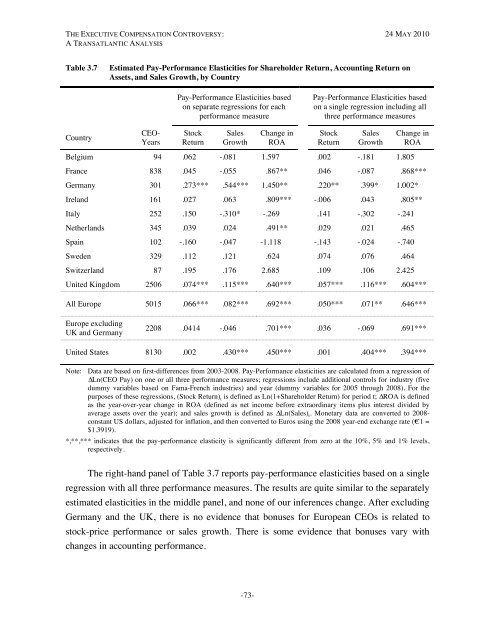
THE EXECUTIVE COMPENSATION CONTROVERSY: 24 MAY 2010A TRANSATLANTIC ANALYSISTable 3.7Estimated Pay-Performance Elasticities for Shareholder Return, Accounting Return onAssets, and Sales Growth, by CountryPay-Performance Elasticities basedon separate regressions for eachperformance measurePay-Performance Elasticities basedon a single regression including allthree performance measuresCountryCEO-YearsStockReturnSalesGrowthChange inROAStockReturnSalesGrowthChange inROABelgium 94 .062 -.081 1.597 .002 -.181 1.805France 838 .045 -.055 .867** .046 -.087 .868***Germany 301 .273*** .544*** 1.450** .220** .399* 1.002*Ireland 161 .027 .063 .809*** -.006 .043 .805**Italy 252 .150 -.310* -.269 .141 -.302 -.241Netherlands 345 .039 .024 .491** .029 .021 .465Spain 102 -.160 -.047 -1.118 -.143 -.024 -.740Sweden 329 .112 .121 .624 .074 .076 .464Switzerland 87 .195 .176 2.685 .109 .106 2.425United Kingdom 2506 .074*** .115*** .640*** .057*** .116*** .604***All Europe 5015 .066*** .082*** .692*** .050*** .071** .646***Europe excludingUK and Germany2208 .0414 -.046 .701*** .036 -.069 .691***United States 8130 .002 .430*** .450*** .001 .404*** .394***Note: Data are based on first-differences from 2003-2008. Pay-Performance elasticities are calculated from a regression of∆Ln(CEO Pay) on one or all three performance measures; regressions include additional controls for industry (fivedummy variables based on Fama-French industries) and year (dummy variables for 2005 through 2008). For thepurposes of these regressions, (Stock Return) t is defined as Ln(1+Shareholder Return) for period t; ∆ROA is definedas the year-over-year change in ROA (defined as net income before extraordinary items plus interest divided byaverage assets over the year); and sales growth is defined as ∆Ln(Sales) t . Monetary data are converted to 2008-constant US dollars, adjusted for inflation, and then converted to Euros using the 2008 year-end exchange rate (€1 =$1.3919).*,**,*** indicates that the pay-performance elasticity is significantly different from zero at the 10%, 5% and 1% levels,respectively.<strong>The</strong> right-hand panel of Table 3.7 reports pay-performance elasticities based on a singleregression with all three performance measures. <strong>The</strong> results are quite similar to the separatelyestimated elasticities in the middle panel, and none of our inferences change. After excludingGermany and the UK, there is no evidence that bonuses for European CEOs is related tostock-price performance or sales growth. <strong>The</strong>re is some evidence that bonuses vary withchanges in accounting performance.-73-