The Executive Compensation Controversy - Fondazione Rodolfo ...
The Executive Compensation Controversy - Fondazione Rodolfo ...
The Executive Compensation Controversy - Fondazione Rodolfo ...

You also want an ePaper? Increase the reach of your titles
YUMPU automatically turns print PDFs into web optimized ePapers that Google loves.
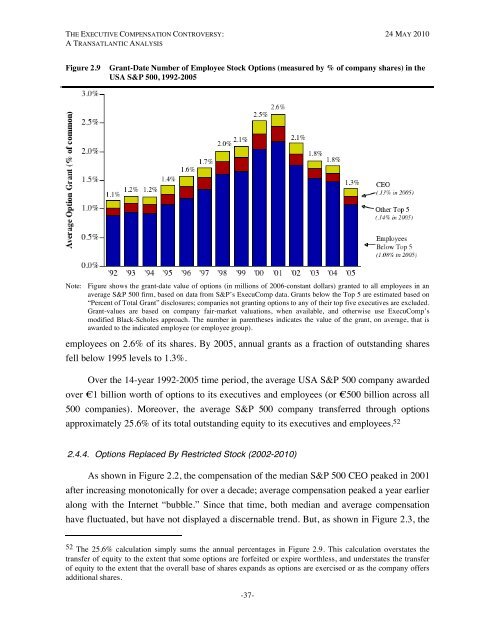
THE EXECUTIVE COMPENSATION CONTROVERSY: 24 MAY 2010A TRANSATLANTIC ANALYSISFigure 2.9Grant-Date Number of Employee Stock Options (measured by % of company shares) in theUSA S&P 500, 1992-2005Note: Figure shows the grant-date value of options (in millions of 2006-constant dollars) granted to all employees in anaverage S&P 500 firm, based on data from S&P’s ExecuComp data. Grants below the Top 5 are estimated based on“Percent of Total Grant” disclosures; companies not granting options to any of their top five executives are excluded.Grant-values are based on company fair-market valuations, when available, and otherwise use ExecuComp’smodified Black-Scholes approach. <strong>The</strong> number in parentheses indicates the value of the grant, on average, that isawarded to the indicated employee (or employee group).employees on 2.6% of its shares. By 2005, annual grants as a fraction of outstanding sharesfell below 1995 levels to 1.3%.Over the 14-year 1992-2005 time period, the average USA S&P 500 company awardedover €1 billion worth of options to its executives and employees (or €500 billion across all500 companies). Moreover, the average S&P 500 company transferred through optionsapproximately 25.6% of its total outstanding equity to its executives and employees. 522.4.4. Options Replaced By Restricted Stock (2002-2010)As shown in Figure 2.2, the compensation of the median S&P 500 CEO peaked in 2001after increasing monotonically for over a decade; average compensation peaked a year earlieralong with the Internet “bubble.” Since that time, both median and average compensationhave fluctuated, but have not displayed a discernable trend. But, as shown in Figure 2.3, the52 <strong>The</strong> 25.6% calculation simply sums the annual percentages in Figure 2.9. This calculation overstates thetransfer of equity to the extent that some options are forfeited or expire worthless, and understates the transferof equity to the extent that the overall base of shares expands as options are exercised or as the company offersadditional shares.-37-