The Executive Compensation Controversy - Fondazione Rodolfo ...
The Executive Compensation Controversy - Fondazione Rodolfo ...
The Executive Compensation Controversy - Fondazione Rodolfo ...

Create successful ePaper yourself
Turn your PDF publications into a flip-book with our unique Google optimized e-Paper software.
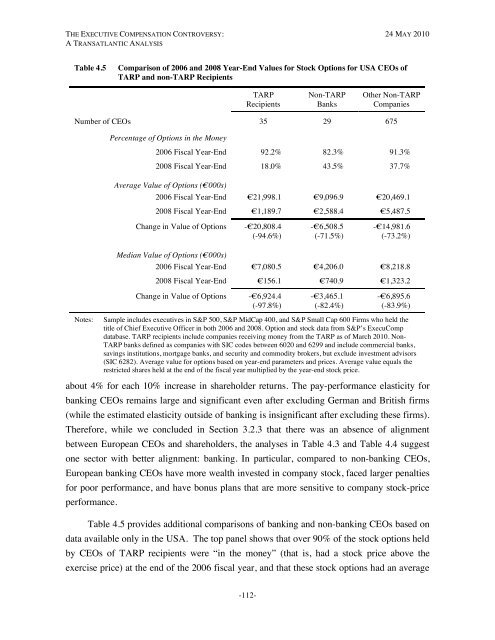
THE EXECUTIVE COMPENSATION CONTROVERSY: 24 MAY 2010A TRANSATLANTIC ANALYSISTable 4.5Comparison of 2006 and 2008 Year-End Values for Stock Options for USA CEOs ofTARP and non-TARP RecipientsTARPRecipientsNon-TARPBanksOther Non-TARPCompaniesNumber of CEOs 35 29 675Percentage of Options in the Money2006 Fiscal Year-End 92.2% 82.3% 91.3%2008 Fiscal Year-End 18.0% 43.5% 37.7%Average Value of Options (€000s)2006 Fiscal Year-End €21,998.1 €9,096.9 €20,469.12008 Fiscal Year-End €1,189.7 €2,588.4 €5,487.5Change in Value of Options -€20,808.4(-94.6%)-€6,508.5(-71.5%)-€14,981.6(-73.2%)Median Value of Options (€000s)2006 Fiscal Year-End €7,080.5 €4,206.0 €8,218.82008 Fiscal Year-End €156.1 €740.9 €1,323.2Change in Value of Options -€6,924.4(-97.8%)-€3,465.1(-82.4%)-€6,895.6(-83.9%)Notes:Sample includes executives in S&P 500, S&P MidCap 400, and S&P Small Cap 600 Firms who held thetitle of Chief <strong>Executive</strong> Officer in both 2006 and 2008. Option and stock data from S&P’s ExecuCompdatabase. TARP recipients include companies receiving money from the TARP as of March 2010. Non-TARP banks defined as companies with SIC codes between 6020 and 6299 and include commercial banks,savings institutions, mortgage banks, and security and commodity brokers, but exclude investment advisors(SIC 6282). Average value for options based on year-end parameters and prices. Average value equals therestricted shares held at the end of the fiscal year multiplied by the year-end stock price.about 4% for each 10% increase in shareholder returns. <strong>The</strong> pay-performance elasticity forbanking CEOs remains large and significant even after excluding German and British firms(while the estimated elasticity outside of banking is insignificant after excluding these firms).<strong>The</strong>refore, while we concluded in Section 3.2.3 that there was an absence of alignmentbetween European CEOs and shareholders, the analyses in Table 4.3 and Table 4.4 suggestone sector with better alignment: banking. In particular, compared to non-banking CEOs,European banking CEOs have more wealth invested in company stock, faced larger penaltiesfor poor performance, and have bonus plans that are more sensitive to company stock-priceperformance.Table 4.5 provides additional comparisons of banking and non-banking CEOs based ondata available only in the USA. <strong>The</strong> top panel shows that over 90% of the stock options heldby CEOs of TARP recipients were “in the money” (that is, had a stock price above theexercise price) at the end of the 2006 fiscal year, and that these stock options had an average-112-