The Executive Compensation Controversy - Fondazione Rodolfo ...
The Executive Compensation Controversy - Fondazione Rodolfo ...
The Executive Compensation Controversy - Fondazione Rodolfo ...

Create successful ePaper yourself
Turn your PDF publications into a flip-book with our unique Google optimized e-Paper software.
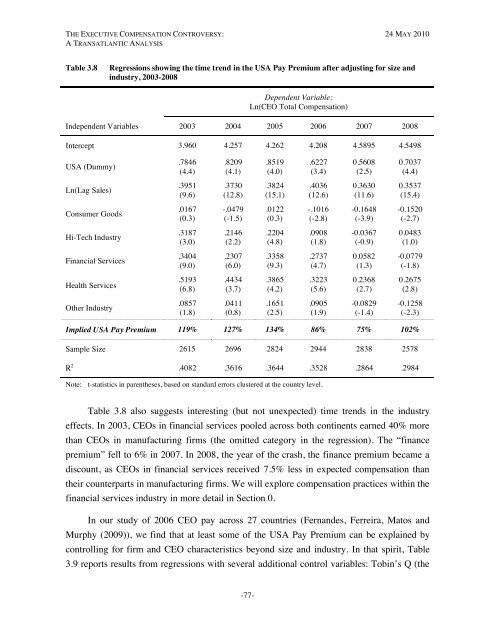
THE EXECUTIVE COMPENSATION CONTROVERSY: 24 MAY 2010A TRANSATLANTIC ANALYSISTable 3.8Regressions showing the time trend in the USA Pay Premium after adjusting for size andindustry, 2003-2008Dependent Variable:Ln(CEO Total <strong>Compensation</strong>)Independent Variables 2003 2004 2005 2006 2007 2008Intercept 3.960 4.257 4.262 4.208 4.5895 4.5498USA (Dummy).7846(4.4).8209(4.1).8519(4.0).6227(3.4)0.5608(2.5)0.7037(4.4)Ln(Lag Sales).3951(9.6).3730(12.8).3824(15.1).4036(12.6)0.3630(11.6)0.3537(15.4)Consumer Goods.0167(0.3)-.0479(-1.5).0122(0.3)-.1016(-2.8)-0.1648(-3.9)-0.1520(-2.7)Hi-Tech Industry.3187(3.0).2146(2.2).2204(4.8).0908(1.8)-0.0367(-0.9)0.0483(1.0)Financial Services.3404(9.0).2307(6.0).3358(9.3).2737(4.7)0.0582(1.3)-0.0779(-1.8)Health Services.5193(6.8).4434(3.7).3865(4.2).3223(5.6)0.2368(2.7)0.2675(2.8)Other Industry.0857(1.8).0411(0.8).1651(2.5).0905(1.9)-0.0829(-1.4)-0.1258(-2.3)Implied USA Pay Premium 119% 127% 134% 86% 75% 102%Sample Size 2615 2696 2824 2944 2838 2578R 2 .4082 .3616 .3644 .3528 .2864 .2984Note: t-statistics in parentheses, based on standard errors clustered at the country level.Table 3.8 also suggests interesting (but not unexpected) time trends in the industryeffects. In 2003, CEOs in financial services pooled across both continents earned 40% morethan CEOs in manufacturing firms (the omitted category in the regression). <strong>The</strong> “financepremium” fell to 6% in 2007. In 2008, the year of the crash, the finance premium became adiscount, as CEOs in financial services received 7.5% less in expected compensation thantheir counterparts in manufacturing firms. We will explore compensation practices within thefinancial services industry in more detail in Section 0.In our study of 2006 CEO pay across 27 countries (Fernandes, Ferreira, Matos andMurphy (2009)), we find that at least some of the USA Pay Premium can be explained bycontrolling for firm and CEO characteristics beyond size and industry. In that spirit, Table3.9 reports results from regressions with several additional control variables: Tobin’s Q (the-77-