The Executive Compensation Controversy - Fondazione Rodolfo ...
The Executive Compensation Controversy - Fondazione Rodolfo ...
The Executive Compensation Controversy - Fondazione Rodolfo ...
You also want an ePaper? Increase the reach of your titles
YUMPU automatically turns print PDFs into web optimized ePapers that Google loves.
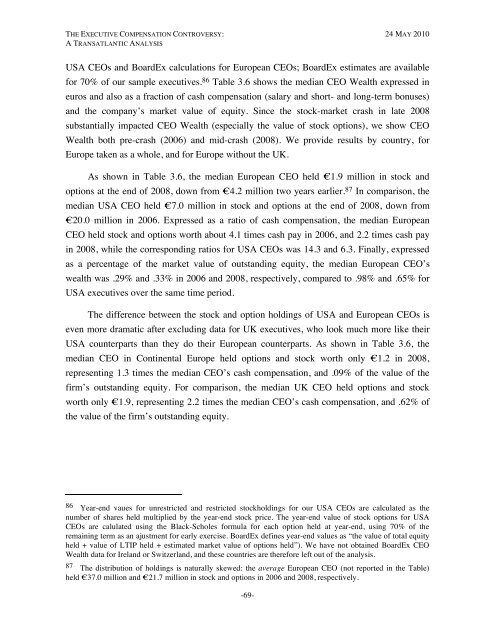
THE EXECUTIVE COMPENSATION CONTROVERSY: 24 MAY 2010A TRANSATLANTIC ANALYSISUSA CEOs and BoardEx calculations for European CEOs; BoardEx estimates are availablefor 70% of our sample executives. 86 Table 3.6 shows the median CEO Wealth expressed ineuros and also as a fraction of cash compensation (salary and short- and long-term bonuses)and the company’s market value of equity. Since the stock-market crash in late 2008substantially impacted CEO Wealth (especially the value of stock options), we show CEOWealth both pre-crash (2006) and mid-crash (2008). We provide results by country, forEurope taken as a whole, and for Europe without the UK.As shown in Table 3.6, the median European CEO held €1.9 million in stock andoptions at the end of 2008, down from €4.2 million two years earlier. 87 In comparison, themedian USA CEO held €7.0 million in stock and options at the end of 2008, down from€20.0 million in 2006. Expressed as a ratio of cash compensation, the median EuropeanCEO held stock and options worth about 4.1 times cash pay in 2006, and 2.2 times cash payin 2008, while the corresponding ratios for USA CEOs was 14.3 and 6.3. Finally, expressedas a percentage of the market value of outstanding equity, the median European CEO’swealth was .29% and .33% in 2006 and 2008, respectively, compared to .98% and .65% forUSA executives over the same time period.<strong>The</strong> difference between the stock and option holdings of USA and European CEOs iseven more dramatic after excluding data for UK executives, who look much more like theirUSA counterparts than they do their European counterparts. As shown in Table 3.6, themedian CEO in Continental Europe held options and stock worth only €1.2 in 2008,representing 1.3 times the median CEO’s cash compensation, and .09% of the value of thefirm’s outstanding equity. For comparison, the median UK CEO held options and stockworth only €1.9, representing 2.2 times the median CEO’s cash compensation, and .62% ofthe value of the firm’s outstanding equity.86 Year-end vaues for unrestricted and restricted stockholdings for our USA CEOs are calculated as thenumber of shares held multiplied by the year-end stock price. <strong>The</strong> year-end value of stock options for USACEOs are calulated using the Black-Scholes formula for each option held at year-end, using 70% of theremaining term as an ajustment for early exercise. BoardEx defines year-end values as “the value of total equityheld + value of LTIP held + estimated market value of options held”). We have not obtained BoardEx CEOWealth data for Ireland or Switzerland, and these countries are therefore left out of the analysis.87 <strong>The</strong> distribution of holdings is naturally skewed: the average European CEO (not reported in the Table)held €37.0 million and €21.7 million in stock and options in 2006 and 2008, respectively.-69-


