The Executive Compensation Controversy - Fondazione Rodolfo ...
The Executive Compensation Controversy - Fondazione Rodolfo ...
The Executive Compensation Controversy - Fondazione Rodolfo ...

Create successful ePaper yourself
Turn your PDF publications into a flip-book with our unique Google optimized e-Paper software.
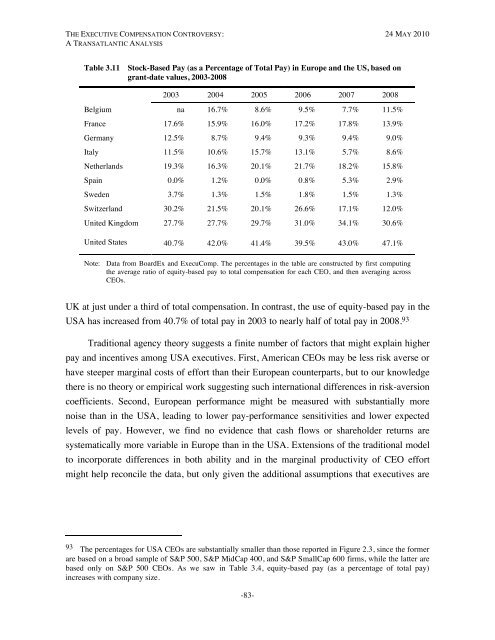
THE EXECUTIVE COMPENSATION CONTROVERSY: 24 MAY 2010A TRANSATLANTIC ANALYSISTable 3.11 Stock-Based Pay (as a Percentage of Total Pay) in Europe and the US, based ongrant-date values, 2003-20082003 2004 2005 2006 2007 2008Belgium na 16.7% 8.6% 9.5% 7.7% 11.5%France 17.6% 15.9% 16.0% 17.2% 17.8% 13.9%Germany 12.5% 8.7% 9.4% 9.3% 9.4% 9.0%Italy 11.5% 10.6% 15.7% 13.1% 5.7% 8.6%Netherlands 19.3% 16.3% 20.1% 21.7% 18.2% 15.8%Spain 0.0% 1.2% 0.0% 0.8% 5.3% 2.9%Sweden 3.7% 1.3% 1.5% 1.8% 1.5% 1.3%Switzerland 30.2% 21.5% 20.1% 26.6% 17.1% 12.0%United Kingdom 27.7% 27.7% 29.7% 31.0% 34.1% 30.6%United States 40.7% 42.0% 41.4% 39.5% 43.0% 47.1%Note: Data from BoardEx and ExecuComp. <strong>The</strong> percentages in the table are constructed by first computingthe average ratio of equity-based pay to total compensation for each CEO, and then averaging acrossCEOs.UK at just under a third of total compensation. In contrast, the use of equity-based pay in theUSA has increased from 40.7% of total pay in 2003 to nearly half of total pay in 2008. 93Traditional agency theory suggests a finite number of factors that might explain higherpay and incentives among USA executives. First, American CEOs may be less risk averse orhave steeper marginal costs of effort than their European counterparts, but to our knowledgethere is no theory or empirical work suggesting such international differences in risk-aversioncoefficients. Second, European performance might be measured with substantially morenoise than in the USA, leading to lower pay-performance sensitivities and lower expectedlevels of pay. However, we find no evidence that cash flows or shareholder returns aresystematically more variable in Europe than in the USA. Extensions of the traditional modelto incorporate differences in both ability and in the marginal productivity of CEO effortmight help reconcile the data, but only given the additional assumptions that executives are93 <strong>The</strong> percentages for USA CEOs are substantially smaller than those reported in Figure 2.3, since the formerare based on a broad sample of S&P 500, S&P MidCap 400, and S&P SmallCap 600 firms, while the latter arebased only on S&P 500 CEOs. As we saw in Table 3.4, equity-based pay (as a percentage of total pay)increases with company size.-83-