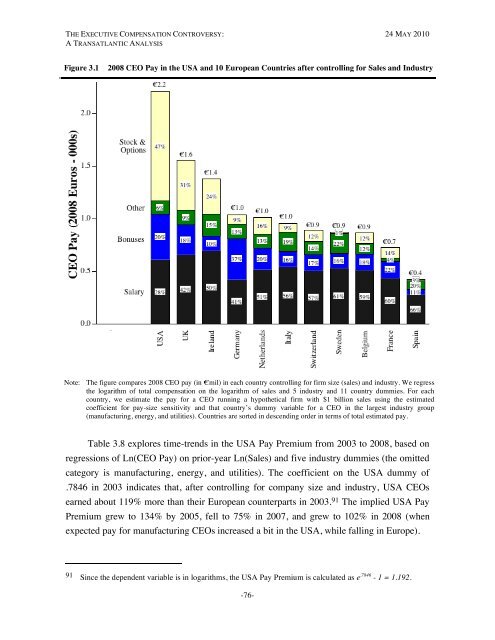
THE EXECUTIVE COMPENSATION CONTROVERSY: 24 MAY 2010A TRANSATLANTIC ANALYSIS• receive most of their compensation in the form of base salaries;• receive three-fourths of their compensation in salaries and bonuses, but bonuses do notappear to vary with shareholder return, accounting performance, or sales growth;• receive less than 12% of their pay in the form of stock or options;• hold relatively little stock relative to their cash compensation or firm value.Overall, we find evidence of strong pay-performance sensitivities in the UK, althoughthey still lag considerably behind their counterparts in the US. We also find some evidencethat bonuses vary with performance for German CEOs. But, for the rest of Europe, we findno evidence that executives on average have incentives aligned with the interest of companyshareholders.3.3. <strong>The</strong> Transatlantic Pay DivideTable 3.2 compared average and median pay for CEOs in the USA and the tenEuropean countries without adjusting for company size or other factors that might effectcompetitive levels of pay across the two continents. In this Section, we will dissect the USA“Pay Premium” more carefully, analyzing time-trends and seeing how much of the observedpremium can be explained by economic factors.As a starting point, Figure 3.1 depicts the level and composition of total compensationfor the USA and ten European countries after controlling for size and industry. In particular,the figure shows the compensation for a CEO in a manufacturing firm with €1 billion inrevenues, estimated from the coefficients of a regression of ln(CEO Total Pay) on ln(LaggedSales), five industry dummy variables, and dummy variables for each country. <strong>The</strong> paycomposition percentages in the figure are constructed by first calculating the compositionpercentages for each CEO, and then averaging across all CEOs in each country. Countries inFigure 3.1 are sorted in descending order in terms of total estimated pay. <strong>The</strong> CEO of a USAmanufacturing firm with €1 billion in prior-year sales is predicted to earn total compensationof €2.2 million annually in 2008, nearly 40% more than the next highest countries (UK andIreland with expected pay levels of €1.6 million and €1.4 million, respectively), and morethan double the predicted compensation for continental Europe. Estimated total pay levels forGermany, the Netherlands, Italy, Switzerland, Sweden, and Belgium are in a statistical deadheataround €1 million, followed by France with €700,000 and Spain with a relative paltry€400,000.-75-
THE EXECUTIVE COMPENSATION CONTROVERSY: 24 MAY 2010A TRANSATLANTIC ANALYSISFigure 3.12008 CEO Pay in the USA and 10 European Countries after controlling for Sales and IndustryNote: <strong>The</strong> figure compares 2008 CEO pay (in €mil) in each country controlling for firm size (sales) and industry. We regressthe logarithm of total compensation on the logarithm of sales and 5 industry and 11 country dummies. For eachcountry, we estimate the pay for a CEO running a hypothetical firm with $1 billion sales using the estimatedcoefficient for pay-size sensitivity and that country’s dummy variable for a CEO in the largest industry group(manufacturing, energy, and utilities). Countries are sorted in descending order in terms of total estimated pay.Table 3.8 explores time-trends in the USA Pay Premium from 2003 to 2008, based onregressions of Ln(CEO Pay) on prior-year Ln(Sales) and five industry dummies (the omittedcategory is manufacturing, energy, and utilities). <strong>The</strong> coefficient on the USA dummy of.7846 in 2003 indicates that, after controlling for company size and industry, USA CEOsearned about 119% more than their European counterparts in 2003. 91 <strong>The</strong> implied USA PayPremium grew to 134% by 2005, fell to 75% in 2007, and grew to 102% in 2008 (whenexpected pay for manufacturing CEOs increased a bit in the USA, while falling in Europe).91 Since the dependent variable is in logarithms, the USA Pay Premium is calculated as e .7846 - 1 = 1.192.-76-