The Executive Compensation Controversy - Fondazione Rodolfo ...
The Executive Compensation Controversy - Fondazione Rodolfo ...
The Executive Compensation Controversy - Fondazione Rodolfo ...

Create successful ePaper yourself
Turn your PDF publications into a flip-book with our unique Google optimized e-Paper software.
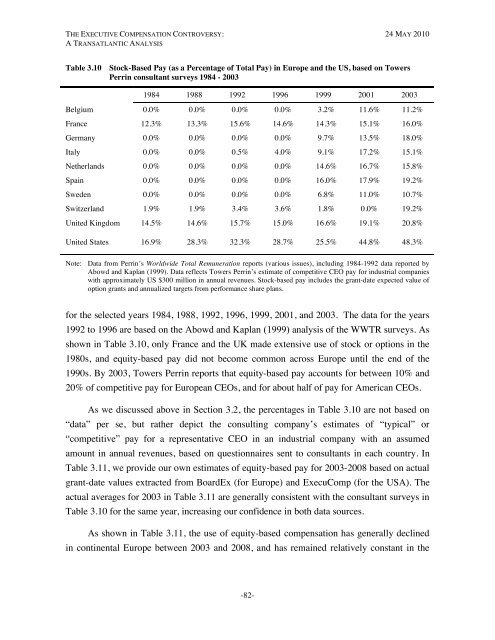
THE EXECUTIVE COMPENSATION CONTROVERSY: 24 MAY 2010A TRANSATLANTIC ANALYSISTable 3.10 Stock-Based Pay (as a Percentage of Total Pay) in Europe and the US, based on TowersPerrin consultant surveys 1984 - 20031984 1988 1992 1996 1999 2001 2003Belgium 0.0% 0.0% 0.0% 0.0% 3.2% 11.6% 11.2%France 12.3% 13.3% 15.6% 14.6% 14.3% 15.1% 16.0%Germany 0.0% 0.0% 0.0% 0.0% 9.7% 13.5% 18.0%Italy 0.0% 0.0% 0.5% 4.0% 9.1% 17.2% 15.1%Netherlands 0.0% 0.0% 0.0% 0.0% 14.6% 16.7% 15.8%Spain 0.0% 0.0% 0.0% 0.0% 16.0% 17.9% 19.2%Sweden 0.0% 0.0% 0.0% 0.0% 6.8% 11.0% 10.7%Switzerland 1.9% 1.9% 3.4% 3.6% 1.8% 0.0% 19.2%United Kingdom 14.5% 14.6% 15.7% 15.0% 16.6% 19.1% 20.8%United States 16.9% 28.3% 32.3% 28.7% 25.5% 44.8% 48.3%Note: Data from Perrin’s Worldwide Total Remuneration reports (various issues), including 1984-1992 data reported byAbowd and Kaplan (1999). Data reflects Towers Perrin’s estimate of competitive CEO pay for industrial companieswith approximately US $300 million in annual revenues. Stock-based pay includes the grant-date expected value ofoption grants and annualized targets from performance share plans.for the selected years 1984, 1988, 1992, 1996, 1999, 2001, and 2003. <strong>The</strong> data for the years1992 to 1996 are based on the Abowd and Kaplan (1999) analysis of the WWTR surveys. Asshown in Table 3.10, only France and the UK made extensive use of stock or options in the1980s, and equity-based pay did not become common across Europe until the end of the1990s. By 2003, Towers Perrin reports that equity-based pay accounts for between 10% and20% of competitive pay for European CEOs, and for about half of pay for American CEOs.As we discussed above in Section 3.2, the percentages in Table 3.10 are not based on“data” per se, but rather depict the consulting company’s estimates of “typical” or“competitive” pay for a representative CEO in an industrial company with an assumedamount in annual revenues, based on questionnaires sent to consultants in each country. InTable 3.11, we provide our own estimates of equity-based pay for 2003-2008 based on actualgrant-date values extracted from BoardEx (for Europe) and ExecuComp (for the USA). <strong>The</strong>actual averages for 2003 in Table 3.11 are generally consistent with the consultant surveys inTable 3.10 for the same year, increasing our confidence in both data sources.As shown in Table 3.11, the use of equity-based compensation has generally declinedin continental Europe between 2003 and 2008, and has remained relatively constant in the-82-