GLE User Manual - Fedora Project Packages GIT repositories
GLE User Manual - Fedora Project Packages GIT repositories
GLE User Manual - Fedora Project Packages GIT repositories

Create successful ePaper yourself
Turn your PDF publications into a flip-book with our unique Google optimized e-Paper software.
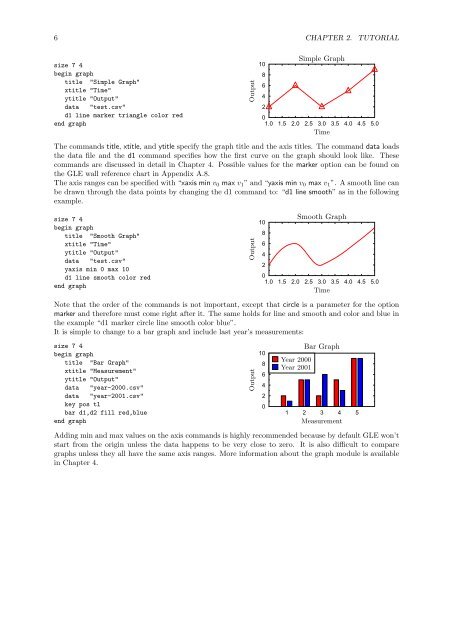
6 CHAPTER 2. TUTORIALsize 7 4begin graphtitle "Simple Graph"xtitle "Time"ytitle "Output"data "test.csv"d1 line marker triangle color redend graphOutput10Simple Graph864201.0 1.5 2.0 2.5 3.0 3.5 4.0 4.5 5.0TimeThe commands title, xtitle, and ytitle specify the graph title and the axis titles. The command data loadsthe data file and the d1 command specifies how the first curve on the graph should look like. Thesecommands are discussed in detail in Chapter 4. Possible values for the marker option can be found onthe <strong>GLE</strong> wall reference chart in Appendix A.8.The axis ranges can be specified with “xaxis min v 0 max v 1 ” and “yaxis min v 0 max v 1 ”. A smooth line canbe drawn through the data points by changing the d1 command to: “d1 line smooth” as in the followingexample.size 7 4begin graphtitle "Smooth Graph"xtitle "Time"ytitle "Output"data "test.csv"yaxis min 0 max 10d1 line smooth color redend graphOutput10Smooth Graph864201.0 1.5 2.0 2.5 3.0 3.5 4.0 4.5 5.0TimeNote that the order of the commands is not important, except that circle is a parameter for the optionmarker and therefore must come right after it. The same holds for line and smooth and color and blue inthe example “d1 marker circle line smooth color blue”.It is simple to change to a bar graph and include last year’s measurements:size 7 4begin graphtitle "Bar Graph"xtitle "Measurement"ytitle "Output"data "year-2000.csv"data "year-2001.csv"key pos tlbar d1,d2 fill red,blueend graphOutput1086420Year 2000Year 2001Bar Graph1 2 3 4 5MeasurementAdding min and max values on the axis commands is highly recommended because by default <strong>GLE</strong> won’tstart from the origin unless the data happens to be very close to zero. It is also difficult to comparegraphs unless they all have the same axis ranges. More information about the graph module is availablein Chapter 4.