GLE User Manual - Fedora Project Packages GIT repositories
GLE User Manual - Fedora Project Packages GIT repositories
GLE User Manual - Fedora Project Packages GIT repositories

Create successful ePaper yourself
Turn your PDF publications into a flip-book with our unique Google optimized e-Paper software.
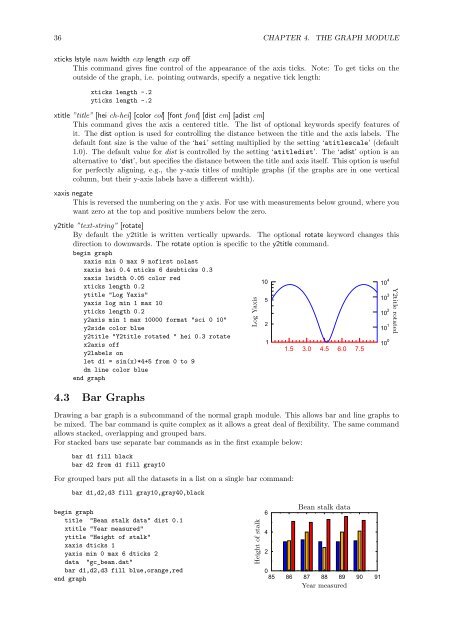
36 CHAPTER 4. THE GRAPH MODULExticks lstyle num lwidth exp length exp offThis command gives fine control of the appearance of the axis ticks. Note: To get ticks on theoutside of the graph, i.e. pointing outwards, specify a negative tick length:xticks length -.2yticks length -.2xtitle ”title” [hei ch-hei] [color col] [font font] [dist cm] [adist cm]This command gives the axis a centered title. The list of optional keywords specify features ofit. The dist option is used for controlling the distance between the title and the axis labels. Thedefault font size is the value of the ‘hei’ setting multiplied by the setting ‘atitlescale’ (default1.0). The default value for dist is controlled by the setting ‘atitledist’. The ‘adist’ option is analternative to ‘dist’, but specifies the distance between the title and axis itself. This option is usefulfor perfectly aligning, e.g., the y-axis titles of multiple graphs (if the graphs are in one verticalcolumn, but their y-axis labels have a different width).xaxis negateThis is reversed the numbering on the y axis. For use with measurements below ground, where youwant zero at the top and positive numbers below the zero.y2title ”text-string” [rotate]By default the y2title is written vertically upwards. The optional rotate keyword changes thisdirection to downwards. The rotate option is specific to the y2title command.begin graphxaxis min 0 max 9 nofirst nolastxaxis hei 0.4 nticks 6 dsubticks 0.3xaxis lwidth 0.05 color redxticks length 0.21010 4ytitle "Log Yaxis"yaxis log min 1 max 10yticks length 0.2y2axis min 1 max 10000 format "sci 0 10"y2side color bluey2title "Y2title rotated " hei 0.3 rotate5210 310 210 1x2axis off110 01.5 3.0 4.5 6.0 7.5y2labels onlet d1 = sin(x)*4+5 from 0 to 9dn line color blueend graph4.3 Bar GraphsDrawing a bar graph is a subcommand of the normal graph module. This allows bar and line graphs tobe mixed. The bar command is quite complex as it allows a great deal of flexibility. The same commandallows stacked, overlapping and grouped bars.For stacked bars use separate bar commands as in the first example below:bar d1 fill blackbar d2 from d1 fill gray10For grouped bars put all the datasets in a list on a single bar command:bar d1,d2,d3 fill gray10,gray40,blackLog YaxisY2title rotatedbegin graphtitle "Bean stalk data" dist 0.1xtitle "Year measured"ytitle "Height of stalk"xaxis dticks 1yaxis min 0 max 6 dticks 2data "gc_bean.dat"bar d1,d2,d3 fill blue,orange,redend graphHeight of stalk6Bean stalk data42085 86 87 88 89 90 91Year measured