GLE User Manual - Fedora Project Packages GIT repositories
GLE User Manual - Fedora Project Packages GIT repositories
GLE User Manual - Fedora Project Packages GIT repositories

Create successful ePaper yourself
Turn your PDF publications into a flip-book with our unique Google optimized e-Paper software.
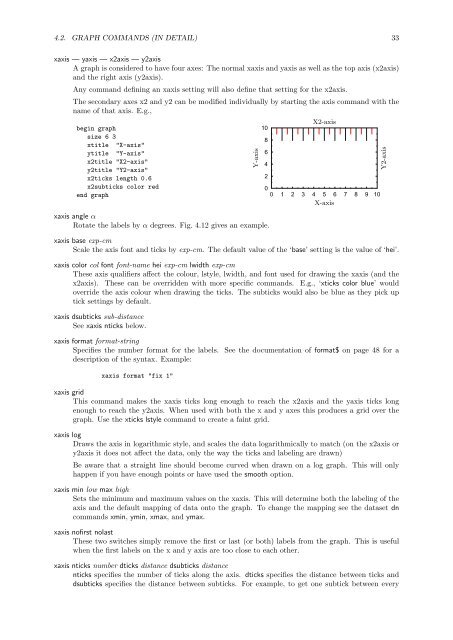
4.2. GRAPH COMMANDS (IN DETAIL) 33xaxis — yaxis — x2axis — y2axisA graph is considered to have four axes: The normal xaxis and yaxis as well as the top axis (x2axis)and the right axis (y2axis).Any command defining an xaxis setting will also define that setting for the x2axis.The secondary axes x2 and y2 can be modified individually by starting the axis command with thename of that axis. E.g.,begin graphsize 6 3xtitle "X-axis"ytitle "Y-axis"x2title "X2-axis"y2title "Y2-axis"x2ticks length 0.6x2subticks color redend graphxaxis angle αRotate the labels by α degrees. Fig. 4.12 gives an example.Y-axis108642X2-axis00 1 2 3 4 5 6 7 8 9 10X-axisxaxis base exp-cmScale the axis font and ticks by exp-cm. The default value of the ‘base’ setting is the value of ‘hei’.xaxis color col font font-name hei exp-cm lwidth exp-cmThese axis qualifiers affect the colour, lstyle, lwidth, and font used for drawing the xaxis (and thex2axis). These can be overridden with more specific commands. E.g., ‘xticks color blue’ wouldoverride the axis colour when drawing the ticks. The subticks would also be blue as they pick uptick settings by default.xaxis dsubticks sub-distanceSee xaxis nticks below.xaxis format format-stringSpecifies the number format for the labels. See the documentation of format$ on page 48 for adescription of the syntax. Example:xaxis format "fix 1"xaxis gridThis command makes the xaxis ticks long enough to reach the x2axis and the yaxis ticks longenough to reach the y2axis. When used with both the x and y axes this produces a grid over thegraph. Use the xticks lstyle command to create a faint grid.xaxis logDraws the axis in logarithmic style, and scales the data logarithmically to match (on the x2axis ory2axis it does not affect the data, only the way the ticks and labeling are drawn)Be aware that a straight line should become curved when drawn on a log graph. This will onlyhappen if you have enough points or have used the smooth option.xaxis min low max highSets the minimum and maximum values on the xaxis. This will determine both the labeling of theaxis and the default mapping of data onto the graph. To change the mapping see the dataset dncommands xmin, ymin, xmax, and ymax.xaxis nofirst nolastThese two switches simply remove the first or last (or both) labels from the graph. This is usefulwhen the first labels on the x and y axis are too close to each other.xaxis nticks number dticks distance dsubticks distancenticks specifies the number of ticks along the axis. dticks specifies the distance between ticks anddsubticks specifies the distance between subticks. For example, to get one subtick between everyY2-axis