GLE User Manual - Fedora Project Packages GIT repositories
GLE User Manual - Fedora Project Packages GIT repositories
GLE User Manual - Fedora Project Packages GIT repositories

You also want an ePaper? Increase the reach of your titles
YUMPU automatically turns print PDFs into web optimized ePapers that Google loves.
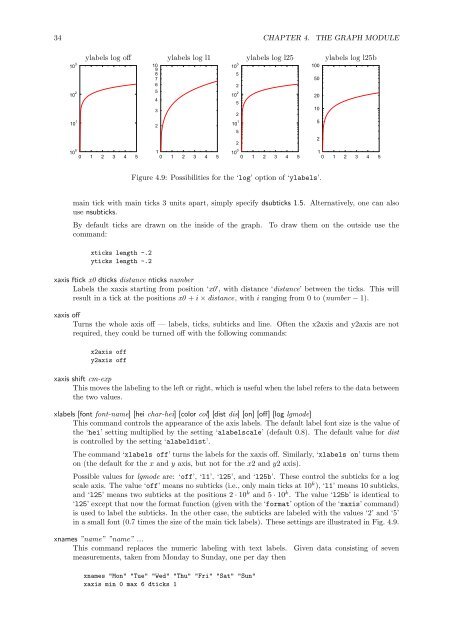
34 CHAPTER 4. THE GRAPH MODULEylabels log off ylabels log l1 ylabels log l25 ylabels log l25b10 310 210 110 00 1 2 3 4 5108 976543210 1 2 3 4 510 3 5210 2 5210 1 5210 0 0 1 2 3 4 51005020105210 1 2 3 4 5Figure 4.9: Possibilities for the ‘log’ option of ‘ylabels’.main tick with main ticks 3 units apart, simply specify dsubticks 1.5. Alternatively, one can alsouse nsubticks.By default ticks are drawn on the inside of the graph.command:xticks length -.2yticks length -.2To draw them on the outside use thexaxis ftick x0 dticks distance nticks numberLabels the xaxis starting from position ‘x0’, with distance ‘distance’ between the ticks. This willresult in a tick at the positions x0 + i × distance, with i ranging from 0 to (number − 1).xaxis offTurns the whole axis off — labels, ticks, subticks and line. Often the x2axis and y2axis are notrequired, they could be turned off with the following commands:x2axis offy2axis offxaxis shift cm-expThis moves the labeling to the left or right, which is useful when the label refers to the data betweenthe two values.xlabels [font font-name] [hei char-hei] [color col] [dist dis] [on] [off] [log lgmode]This command controls the appearance of the axis labels. The default label font size is the value ofthe ‘hei’ setting multiplied by the setting ‘alabelscale’ (default 0.8). The default value for distis controlled by the setting ‘alabeldist’.The command ‘xlabels off’ turns the labels for the xaxis off. Similarly, ‘xlabels on’ turns themon (the default for the x and y axis, but not for the x2 and y2 axis).Possible values for lgmode are: ‘off’, ‘l1’, ‘l25’, and ‘l25b’. These control the subticks for a logscale axis. The value ‘off’ means no subticks (i.e., only main ticks at 10 k ), ‘l1’ means 10 subticks,and ‘l25’ means two subticks at the positions 2 · 10 k and 5 · 10 k . The value ‘l25b’ is identical to‘l25’ except that now the format function (given with the ‘format’ option of the ‘xaxis’ command)is used to label the subticks. In the other case, the subticks are labeled with the values ‘2’ and ‘5’in a small font (0.7 times the size of the main tick labels). These settings are illustrated in Fig. 4.9.xnames ”name” ”name” ...This command replaces the numeric labeling with text labels.measurements, taken from Monday to Sunday, one per day thenGiven data consisting of sevenxnames "Mon" "Tue" "Wed" "Thu" "Fri" "Sat" "Sun"xaxis min 0 max 6 dticks 1