GLE User Manual - Fedora Project Packages GIT repositories
GLE User Manual - Fedora Project Packages GIT repositories
GLE User Manual - Fedora Project Packages GIT repositories

Create successful ePaper yourself
Turn your PDF publications into a flip-book with our unique Google optimized e-Paper software.
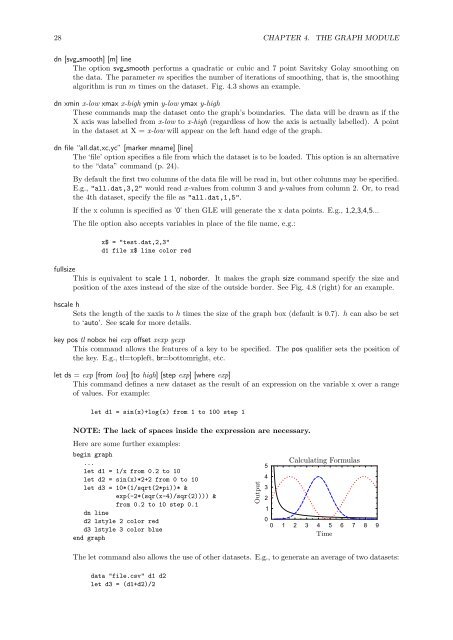
28 CHAPTER 4. THE GRAPH MODULEdn [svg smooth] [m] lineThe option svg smooth performs a quadratic or cubic and 7 point Savitsky Golay smoothing onthe data. The parameter m specifies the number of iterations of smoothing, that is, the smoothingalgorithm is run m times on the dataset. Fig. 4.3 shows an example.dn xmin x-low xmax x-high ymin y-low ymax y-highThese commands map the dataset onto the graph’s boundaries. The data will be drawn as if theX axis was labelled from x-low to x-high (regardless of how the axis is actually labelled). A pointin the dataset at X = x-low will appear on the left hand edge of the graph.dn file “all.dat,xc,yc” [marker mname] [line]The ‘file’ option specifies a file from which the dataset is to be loaded. This option is an alternativeto the “data” command (p. 24).By default the first two columns of the data file will be read in, but other columns may be specified.E.g., "all.dat,3,2" would read x-values from column 3 and y-values from column 2. Or, to readthe 4th dataset, specify the file as "all.dat,1,5".If the x column is specified as ’0’ then <strong>GLE</strong> will generate the x data points. E.g., 1,2,3,4,5...The file option also accepts variables in place of the file name, e.g.:x$ = "test.dat,2,3"d1 file x$ line color redfullsizeThis is equivalent to scale 1 1, noborder. It makes the graph size command specify the size andposition of the axes instead of the size of the outside border. See Fig. 4.8 (right) for an example.hscale hSets the length of the xaxis to h times the size of the graph box (default is 0.7). h can also be setto ‘auto’. See scale for more details.key pos tl nobox hei exp offset xexp yexpThis command allows the features of a key to be specified. The pos qualifier sets the position ofthe key. E.g., tl=topleft, br=bottomright, etc.let ds = exp [from low] [to high] [step exp] [where exp]This command defines a new dataset as the result of an expression on the variable x over a rangeof values. For example:let d1 = sin(x)+log(x) from 1 to 100 step 1NOTE: The lack of spaces inside the expression are necessary.Here are some further examples:begin graph...let d1 = 1/x from 0.2 to 10let d2 = sin(x)*2+2 from 0 to 10let d3 = 10*(1/sqrt(2*pi))* &exp(-2*(sqr(x-4)/sqr(2)))) &from 0.2 to 10 step 0.1dn lined2 lstyle 2 color redd3 lstyle 3 color blueend graphOutput54321Calculating Formulas00 1 2 3 4 5 6 7 8 9TimeThe let command also allows the use of other datasets. E.g., to generate an average of two datasets:data "file.csv" d1 d2let d3 = (d1+d2)/2