GLE User Manual - Fedora Project Packages GIT repositories
GLE User Manual - Fedora Project Packages GIT repositories
GLE User Manual - Fedora Project Packages GIT repositories

You also want an ePaper? Increase the reach of your titles
YUMPU automatically turns print PDFs into web optimized ePapers that Google loves.
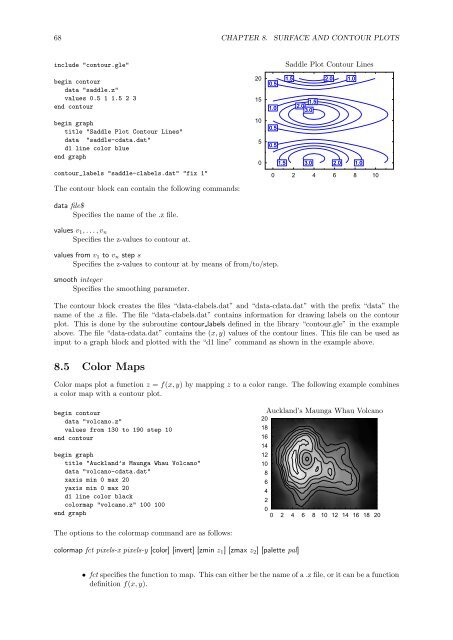
68 CHAPTER 8. SURFACE AND CONTOUR PLOTSinclude "contour.gle"begin contourdata "saddle.z"values 0.5 1 1.5 2 3end contourbegin graphtitle "Saddle Plot Contour Lines"data "saddle-cdata.dat"d1 line color blueend graphcontour_labels "saddle-clabels.dat" "fix 1"The contour block can contain the following commands:data file$Specifies the name of the .z file.values v 1 , . . . , v nSpecifies the z-values to contour at.201510500.51.00.50.5Saddle Plot Contour Lines1.5 2.01.52.0 3.01.01.5 3.02.01.00 2 4 6 8 10values from v 1 to v n step sSpecifies the z-values to contour at by means of from/to/step.smooth integerSpecifies the smoothing parameter.The contour block creates the files “data-clabels.dat” and “data-cdata.dat” with the prefix “data” thename of the .z file. The file “data-clabels.dat” contains information for drawing labels on the contourplot. This is done by the subroutine contour labels defined in the library “contour.gle” in the exampleabove. The file “data-cdata.dat” contains the (x, y) values of the contour lines. This file can be used asinput to a graph block and plotted with the “d1 line” command as shown in the example above.8.5 Color MapsColor maps plot a function z = f(x, y) by mapping z to a color range. The following example combinesa color map with a contour plot.begin contourdata "volcano.z"values from 130 to 190 step 10end contourbegin graphtitle "Auckland’s Maunga Whau Volcano"data "volcano-cdata.dat"xaxis min 0 max 20yaxis min 0 max 20d1 line color blackcolormap "volcano.z" 100 100end graphAuckland’s Maunga Whau Volcano201816141210864200 2 4 6 8 10 12 14 16 18 20The options to the colormap command are as follows:colormap fct pixels-x pixels-y [color] [invert] [zmin z 1 ] [zmax z 2 ] [palette pal]• fct specifies the function to map. This can either be the name of a .z file, or it can be a functiondefinition f(x, y).