GLE User Manual - Fedora Project Packages GIT repositories
GLE User Manual - Fedora Project Packages GIT repositories
GLE User Manual - Fedora Project Packages GIT repositories

Create successful ePaper yourself
Turn your PDF publications into a flip-book with our unique Google optimized e-Paper software.
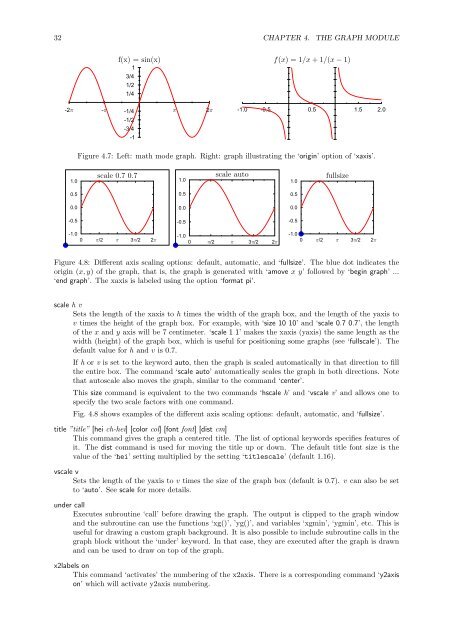
32 CHAPTER 4. THE GRAPH MODULEf(x) = sin(x) f(x) = 1/x + 1/(x − 1)13/41/21/4-2 - -1/42 -1.0 -0.5 0.5 1.5 2.0-1/2-3/4-1Figure 4.7: Left: math mode graph. Right: graph illustrating the ‘origin’ option of ‘xaxis’.1.0scale 0.7 0.7 scale auto fullsize1.01.00.50.0-0.5-1.00 /2 3 /2 20.50.0-0.5-1.00 /2 3 /2 20.50.0-0.5-1.00 /2 3 /2 2Figure 4.8: Different axis scaling options: default, automatic, and ‘fullsize’. The blue dot indicates theorigin (x, y) of the graph, that is, the graph is generated with ‘amove x y’ followed by ‘begin graph’ ...‘end graph’. The xaxis is labeled using the option ‘format pi’.scale h vSets the length of the xaxis to h times the width of the graph box, and the length of the yaxis tov times the height of the graph box. For example, with ‘size 10 10’ and ‘scale 0.7 0.7’, the lengthof the x and y axis will be 7 centimeter. ‘scale 1 1’ makes the xaxis (yaxis) the same length as thewidth (height) of the graph box, which is useful for positioning some graphs (see ‘fullscale’). Thedefault value for h and v is 0.7.If h or v is set to the keyword auto, then the graph is scaled automatically in that direction to fillthe entire box. The command ‘scale auto’ automatically scales the graph in both directions. Notethat autoscale also moves the graph, similar to the command ‘center’.This size command is equivalent to the two commands ‘hscale h’ and ‘vscale v’ and allows one tospecify the two scale factors with one command.Fig. 4.8 shows examples of the different axis scaling options: default, automatic, and ‘fullsize’.title ”title” [hei ch-hei] [color col] [font font] [dist cm]This command gives the graph a centered title. The list of optional keywords specifies features ofit. The dist command is used for moving the title up or down. The default title font size is thevalue of the ‘hei’ setting multiplied by the setting ‘titlescale’ (default 1.16).vscale vSets the length of the yaxis to v times the size of the graph box (default is 0.7). v can also be setto ‘auto’. See scale for more details.under callExecutes subroutine ‘call’ before drawing the graph. The output is clipped to the graph windowand the subroutine can use the functions ‘xg()’, ’yg()’, and variables ‘xgmin’, ‘ygmin’, etc. This isuseful for drawing a custom graph background. It is also possible to include subroutine calls in thegraph block without the ‘under’ keyword. In that case, they are executed after the graph is drawnand can be used to draw on top of the graph.x2labels onThis command ‘activates’ the numbering of the x2axis. There is a corresponding command ‘y2axison’ which will activate y2axis numbering.