calculational sense method <strong>of</strong> estimation <strong>of</strong> those parameters, <strong>the</strong>method <strong>of</strong> maximal likelihood. It can also be realized <strong>and</strong> it is believedthat, for <strong>the</strong> data given, both methods provide results very close toeach o<strong>the</strong>r. It is <strong>in</strong>terest<strong>in</strong>g, however, to see what practical conclusionswere made <strong>in</strong> <strong>the</strong> cited source. After estimat<strong>in</strong>g somehow <strong>the</strong> values <strong>of</strong><strong>the</strong> parameters, we can apply formula (2.9) to f<strong>in</strong>d out <strong>the</strong> approximatevalue <strong>of</strong> <strong>the</strong> probability ˆp <strong>of</strong> develop<strong>in</strong>g <strong>the</strong> IHD for each exam<strong>in</strong>edperson dur<strong>in</strong>g <strong>the</strong> next 12 years.The highest probabilities were observed for men <strong>of</strong> 30 – 39 <strong>and</strong> 40 –49 years (0.986 <strong>and</strong> 0.742 that <strong>the</strong> IHD developed) <strong>and</strong> 50 – 62 years(0.770 did not develop). For women <strong>the</strong> probabilities <strong>of</strong> develop<strong>in</strong>g <strong>the</strong>disease were 0.838 for ages 30 – 49 <strong>and</strong> 0.773 for ages 50 – 62 [that itdid not develop?]. To a certa<strong>in</strong> extent <strong>the</strong>se results refute <strong>the</strong> classicalsay<strong>in</strong>g which served as <strong>the</strong> title <strong>of</strong> this § 2.2. True, it should be borne<strong>in</strong> m<strong>in</strong>d that formally <strong>the</strong>se figures concern forecast<strong>in</strong>g alreadyhappened events. Such a forecast <strong>of</strong> future events is only possible if<strong>the</strong> coefficients <strong>of</strong> function (2.9) are roughly <strong>the</strong> same <strong>in</strong> ano<strong>the</strong>r placeor time as those established by <strong>the</strong> authors. Such a supposition isprobable but not yet verified.Then, hav<strong>in</strong>g arranged <strong>the</strong> set <strong>of</strong> values ˆp for each exam<strong>in</strong>edperson, <strong>the</strong>y can be subdivided <strong>in</strong>to several equally numerous groups(<strong>of</strong> ten people, for example) such that those with <strong>the</strong> lowest values <strong>of</strong>ˆp are placed <strong>in</strong> <strong>the</strong> first <strong>of</strong> <strong>the</strong>m, people hav<strong>in</strong>g higher, still higher, ...values comprise <strong>the</strong> second, third, ... group. Had <strong>the</strong>re been noconnection between <strong>the</strong> considered l<strong>in</strong>ear comb<strong>in</strong>ation <strong>of</strong> risk factorswith <strong>the</strong> IHD, <strong>the</strong> number <strong>of</strong> cases <strong>of</strong> that disease <strong>in</strong> all groups wouldhave been approximately <strong>the</strong> same, but actually <strong>the</strong> emerged picture isdifferent <strong>in</strong> pr<strong>in</strong>ciple, see for example Table 3 borrowed from Truett etal (1967). The expected number <strong>of</strong> cases <strong>of</strong> <strong>the</strong> IHD was determ<strong>in</strong>edby summ<strong>in</strong>g up <strong>the</strong> probabilities ˆp <strong>of</strong> all people <strong>in</strong> <strong>the</strong> appropriategroup.In that table, we are surprised first <strong>of</strong> all by <strong>the</strong> great difference(amount<strong>in</strong>g to a few dozen times) between <strong>the</strong> sickness rate <strong>in</strong> groups<strong>of</strong> high <strong>and</strong> low risk. Second, <strong>in</strong> spite <strong>of</strong> <strong>the</strong> obvious non-normality <strong>of</strong><strong>the</strong> distributions, <strong>the</strong> results obta<strong>in</strong>ed by means <strong>of</strong> a normality modelagree well with <strong>the</strong> actual data. The isolation <strong>of</strong> groups <strong>of</strong> people witha higher danger <strong>of</strong> develop<strong>in</strong>g <strong>the</strong> IHD is thus possible by issu<strong>in</strong>g from<strong>the</strong> most simple cl<strong>in</strong>ical exam<strong>in</strong>ation (provid<strong>in</strong>g <strong>the</strong> listed above riskfactors). The same conclusion can be made when consider<strong>in</strong>g <strong>the</strong> datarepresented <strong>in</strong> separate age groups.However, it should not be thought that those results are reallysuitable for <strong>in</strong>dividual forecasts. Those can only be successful forcases <strong>of</strong> very high or very low <strong>in</strong>dividual risk ˆp but for all <strong>the</strong> totality<strong>the</strong> result would have been bad. This is connected with <strong>the</strong> IHDoccurr<strong>in</strong>g never<strong>the</strong>less rarely (11.8% <strong>in</strong> <strong>the</strong> mean for 12 years).Indeed, issu<strong>in</strong>g from <strong>the</strong> values <strong>of</strong> ˆp we can only forecast <strong>the</strong> disease<strong>in</strong> people with a sufficiently high ˆp <strong>and</strong> <strong>the</strong> opposite for all <strong>the</strong> o<strong>the</strong>rs.When choos<strong>in</strong>g <strong>the</strong> boundary <strong>of</strong> <strong>the</strong> group with <strong>the</strong> highest risk <strong>in</strong>Table 3 as <strong>the</strong> critical value <strong>of</strong> ˆp , a forecast <strong>of</strong> <strong>the</strong> disease would havebeen wrong <strong>in</strong> 100 – 37.5 = 62.5% <strong>of</strong> cases. And on <strong>the</strong> o<strong>the</strong>r h<strong>and</strong>110
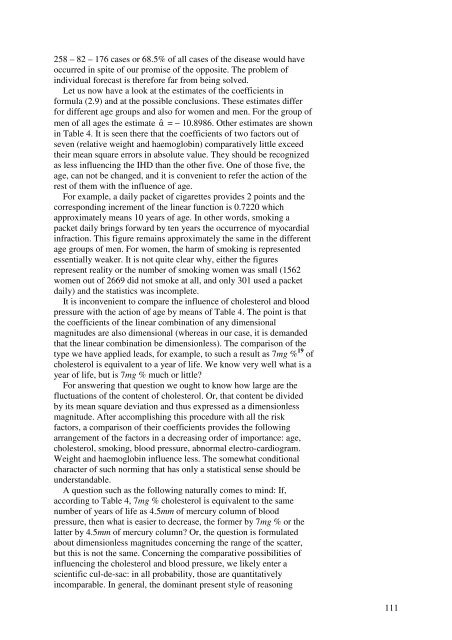
258 – 82 – 176 cases or 68.5% <strong>of</strong> all cases <strong>of</strong> <strong>the</strong> disease would haveoccurred <strong>in</strong> spite <strong>of</strong> our promise <strong>of</strong> <strong>the</strong> opposite. The problem <strong>of</strong><strong>in</strong>dividual forecast is <strong>the</strong>refore far from be<strong>in</strong>g solved.Let us now have a look at <strong>the</strong> estimates <strong>of</strong> <strong>the</strong> coefficients <strong>in</strong>formula (2.9) <strong>and</strong> at <strong>the</strong> possible conclusions. These estimates differfor different age groups <strong>and</strong> also for women <strong>and</strong> men. For <strong>the</strong> group <strong>of</strong>men <strong>of</strong> all ages <strong>the</strong> estimate ˆα = − 10.8986. O<strong>the</strong>r estimates are shown<strong>in</strong> Table 4. It is seen <strong>the</strong>re that <strong>the</strong> coefficients <strong>of</strong> two factors out <strong>of</strong>seven (relative weight <strong>and</strong> haemoglob<strong>in</strong>) comparatively little exceed<strong>the</strong>ir mean square errors <strong>in</strong> absolute value. They should be recognizedas less <strong>in</strong>fluenc<strong>in</strong>g <strong>the</strong> IHD than <strong>the</strong> o<strong>the</strong>r five. One <strong>of</strong> those five, <strong>the</strong>age, can not be changed, <strong>and</strong> it is convenient to refer <strong>the</strong> action <strong>of</strong> <strong>the</strong>rest <strong>of</strong> <strong>the</strong>m with <strong>the</strong> <strong>in</strong>fluence <strong>of</strong> age.For example, a daily packet <strong>of</strong> cigarettes provides 2 po<strong>in</strong>ts <strong>and</strong> <strong>the</strong>correspond<strong>in</strong>g <strong>in</strong>crement <strong>of</strong> <strong>the</strong> l<strong>in</strong>ear function is 0.7220 whichapproximately means 10 years <strong>of</strong> age. In o<strong>the</strong>r words, smok<strong>in</strong>g apacket daily br<strong>in</strong>gs forward by ten years <strong>the</strong> occurrence <strong>of</strong> myocardial<strong>in</strong>fraction. This figure rema<strong>in</strong>s approximately <strong>the</strong> same <strong>in</strong> <strong>the</strong> differentage groups <strong>of</strong> men. For women, <strong>the</strong> harm <strong>of</strong> smok<strong>in</strong>g is representedessentially weaker. It is not quite clear why, ei<strong>the</strong>r <strong>the</strong> figuresrepresent reality or <strong>the</strong> number <strong>of</strong> smok<strong>in</strong>g women was small (1562women out <strong>of</strong> 2669 did not smoke at all, <strong>and</strong> only 301 used a packetdaily) <strong>and</strong> <strong>the</strong> statistics was <strong>in</strong>complete.It is <strong>in</strong>convenient to compare <strong>the</strong> <strong>in</strong>fluence <strong>of</strong> cholesterol <strong>and</strong> bloodpressure with <strong>the</strong> action <strong>of</strong> age by means <strong>of</strong> Table 4. The po<strong>in</strong>t is that<strong>the</strong> coefficients <strong>of</strong> <strong>the</strong> l<strong>in</strong>ear comb<strong>in</strong>ation <strong>of</strong> any dimensionalmagnitudes are also dimensional (whereas <strong>in</strong> our case, it is dem<strong>and</strong>edthat <strong>the</strong> l<strong>in</strong>ear comb<strong>in</strong>ation be dimensionless). The comparison <strong>of</strong> <strong>the</strong>type we have applied leads, for example, to such a result as 7mg % 19 <strong>of</strong>cholesterol is equivalent to a year <strong>of</strong> life. We know very well what is ayear <strong>of</strong> life, but is 7mg % much or little?For answer<strong>in</strong>g that question we ought to know how large are <strong>the</strong>fluctuations <strong>of</strong> <strong>the</strong> content <strong>of</strong> cholesterol. Or, that content be dividedby its mean square deviation <strong>and</strong> thus expressed as a dimensionlessmagnitude. After accomplish<strong>in</strong>g this procedure with all <strong>the</strong> riskfactors, a comparison <strong>of</strong> <strong>the</strong>ir coefficients provides <strong>the</strong> follow<strong>in</strong>garrangement <strong>of</strong> <strong>the</strong> factors <strong>in</strong> a decreas<strong>in</strong>g order <strong>of</strong> importance: age,cholesterol, smok<strong>in</strong>g, blood pressure, abnormal electro-cardiogram.Weight <strong>and</strong> haemoglob<strong>in</strong> <strong>in</strong>fluence less. The somewhat conditionalcharacter <strong>of</strong> such norm<strong>in</strong>g that has only a statistical sense should beunderst<strong>and</strong>able.A question such as <strong>the</strong> follow<strong>in</strong>g naturally comes to m<strong>in</strong>d: If,accord<strong>in</strong>g to Table 4, 7mg % cholesterol is equivalent to <strong>the</strong> samenumber <strong>of</strong> years <strong>of</strong> life as 4.5mm <strong>of</strong> mercury column <strong>of</strong> bloodpressure, <strong>the</strong>n what is easier to decrease, <strong>the</strong> former by 7mg % or <strong>the</strong>latter by 4.5mm <strong>of</strong> mercury column? Or, <strong>the</strong> question is formulatedabout dimensionless magnitudes concern<strong>in</strong>g <strong>the</strong> range <strong>of</strong> <strong>the</strong> scatter,but this is not <strong>the</strong> same. Concern<strong>in</strong>g <strong>the</strong> comparative possibilities <strong>of</strong><strong>in</strong>fluenc<strong>in</strong>g <strong>the</strong> cholesterol <strong>and</strong> blood pressure, we likely enter ascientific cul-de-sac: <strong>in</strong> all probability, those are quantitatively<strong>in</strong>comparable. In general, <strong>the</strong> dom<strong>in</strong>ant present style <strong>of</strong> reason<strong>in</strong>g111
- Page 1 and 2:
Studies in the History of Statistic
- Page 3 and 4:
Introduction by CompilerI am presen
- Page 5 and 6:
(Lect. Notes Math., No. 1021, 1983,
- Page 7 and 8:
sufficiently securely that a carefu
- Page 9 and 10:
is energy?) from chapter 4 of Feynm
- Page 11 and 12:
demand to apply transfinite numbers
- Page 13 and 14:
for stating that Ω consists of ele
- Page 15 and 16:
chances to draw a more suitable apa
- Page 17 and 18:
Let the space of elementary events
- Page 19 and 20:
2.3. Independence. When desiring to
- Page 21 and 22:
Eξ = ∑ aipi.Our form of definiti
- Page 23 and 24:
absolutely precisely if the pertine
- Page 25 and 26:
where x is any real number. If dens
- Page 27 and 28:
probability can be coupled with an
- Page 29 and 30:
Nowadays we are sure that no indepe
- Page 31 and 32:
λ = λ(T)with λ(T) being actually
- Page 33 and 34:
(1/B n )(m − A n )instead of the
- Page 35 and 36:
along with ξ. For example, if ξ i
- Page 37 and 38:
µ( − p0) ÷np0 (1 − p0)nhas an
- Page 39 and 40:
distribution of the maximal term |s
- Page 41 and 42:
ξ (ω) + ... + ξ (ω)n1n{ω :|
- Page 43 and 44:
P{max ξ(t) ≥ x} = 0.01, 0 ≤ t
- Page 45 and 46:
1. This example and considerations
- Page 47 and 48:
IIV. N. TutubalinTreatment of Obser
- Page 49 and 50:
structure of statistical methods, d
- Page 51 and 52:
Suppose that we have adopted the pa
- Page 53 and 54:
and the variances are inversely pro
- Page 55 and 56:
It is interesting therefore to see
- Page 57 and 58:
is applied with P(t) being a polyno
- Page 59 and 60: ut some mathematical tricks describ
- Page 61 and 62: It is clear therefore that no speci
- Page 63 and 64: of various groups of machines, and
- Page 65 and 66: nnA(λ) x sin λ t, B(λ) = x cosλ
- Page 67 and 68: of the mathematical model of the Br
- Page 69 and 70: dF(λ) = f (λ) dλ, so that B( t
- Page 71 and 72: usually very little of them. Indeed
- Page 73 and 74: This is the celebrated model of aut
- Page 75 and 76: applications of the theory of stoch
- Page 77 and 78: achieved by differentiating because
- Page 79 and 80: u(x 1 , x 2 , t 1 , t 2 ) = v(x 1 ,
- Page 81 and 82: Reasoning based on common sense and
- Page 83 and 84: answering that question is extremel
- Page 85 and 86: IIIV. N. TutubalinThe Boundaries of
- Page 87 and 88: periodograms. It occurred that work
- Page 89 and 90: at point x = 1. However, preceding
- Page 91 and 92: He concludes that since the action
- Page 93 and 94: The verification of the truth of a
- Page 95 and 96: In the purely scientific sense this
- Page 97 and 98: ought to learn at once the simple t
- Page 99 and 100: the material world science had inde
- Page 101 and 102: values of (2.1) realized in the n e
- Page 103 and 104: *several dozen. The totality µ ica
- Page 105 and 106: Mendelian laws. It is not sufficien
- Page 107 and 108: example, the problem of the objecti
- Page 109: a linear function is not restricted
- Page 113 and 114: The Framingham investigation indeed
- Page 115 and 116: or, for discrete observations,IT(ω
- Page 117 and 118: What objections can be made? First,
- Page 119 and 120: eliability and queuing are known to
- Page 121 and 122: Kolman E. (1939 Russian), Perversio
- Page 123 and 124: measurement is provided. Recently,
- Page 125 and 126: which means that sooner or later th
- Page 127 and 128: The foundations of the Mises approa
- Page 129 and 130: A rather subtle arsenal is develope
- Page 131 and 132: 4.3. General remarks on §§ 4.1 an
- Page 133 and 134: BibliographyAlimov Yu. I. (1976, 19
- Page 135 and 136: processes are now going on in the s
- Page 137 and 138: obtaining a deviation from the theo
- Page 139 and 140: VIOscar SheyninOn the Bernoulli Law