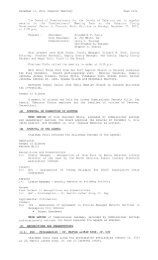
Economic Indicators<strong>Cabarrus</strong> New Business DevelopmentMonthPermitted New Investment Projected New Jobs<strong>2012</strong> 2011 <strong>2012</strong> 2011January $21,182,971 $ 10,177,002 23 11February 10,522,267 1,929,220 48 18March 12,714,654 36<strong>April</strong> 3,575,664 14May 3,181,957 45June 5,183,025 46July 6,173,458 104August 2,325,000 40September 5,742,473 <strong>16</strong>October 3,093,229 57November 5,247,284 37December 14,236,340 84YTD TOTALS $31,705,238 $12,106,222 71 29Source: <strong>Cabarrus</strong> <strong>County</strong> GovernmentEmployment Numbers<strong>Cabarrus</strong> MSA NCMonth<strong>2012</strong> 2011 <strong>2012</strong> 2011 <strong>2012</strong> 2011January 73,778 754,272 4,<strong>16</strong>5,580 3,972,071February 73,870 754,691 3,988,635March 74,591 761,931 4,039,504<strong>April</strong> 74,779 764,454 4,046,108May 75,035 766,638 4,078,947June 74,310 759,283 4,058,951July 74,665 760,905 4,084,865August 74,588 762,190 4,039,244September 75,212 767,849 4,062,311October 75,071 767,001 4,071,114November 74,877 764,709 4,070,112December 74,405 760,131 4,038,091YTD Average 74,598 762,005 4,<strong>16</strong>5,580 3,972,071% Change YTD -.03% .03% 4.87%Source: NC Employment Security CommissionI-4Page 274
Unemployment RateMonth<strong>Cabarrus</strong> MSA NC US<strong>2012</strong> 2011 <strong>2012</strong> 2011 <strong>2012</strong> 2011 <strong>2012</strong> 2011January 10.8 11.2 10.5 10.4 8.8 9.8February 10.3 10.9 10.1 8.7 9.5March 9.8 10.5 9.7 9.2<strong>April</strong> 9.5 10.3 9.6 8.7May 9.6 10.6 9.7 8.7June 10.4 11.3 10.4 9.3July 10.5 11.3 10.4 9.3August 10.4 11.3 10.5 9.1September 9.7 10.7 10.0 8.8October 9.6 10.3 9.7 8.5November 9.3 9.9 9.5 8.2December 9.8 10.3 9.8 8.3YTD Average 10.0 10.7 10.5 10.4 8.8 9.7% Change YTD -11.5% -7.76% .96% -9.28%Source: NC Employment Security CommissionTaxable Sales RevenueMonth<strong>Cabarrus</strong>Rowan<strong>2012</strong> 2011 <strong>2012</strong> 2011January $253,712,435 $225,568,148 $97,129,954 $95,479,014February 149,076,315 71,462,930March 156,444,460 135,258,036<strong>April</strong> 183,636,974 18,568,480May 182,668,006 75,028,329June 176,328,480 76,086,517July 181,983,558 87,340,133August 179,750,238 76,118,255September <strong>16</strong>7,717,538 79,856,894October 171,873,0<strong>16</strong> 81,688,771November 180,154,958 76,840,170December 193,266,378 74,619,036YTD TOTALS 253,712,435 225,568,148 97,129,954 95,479,014% Change YTD 12.48% 1.73%Source: North Carolina Department of RevenueI-4Page 275
- Page 1 and 2:
CABARRUS COUNTYBOARD OF COMMISSIONE
- Page 3:
3. Request for Applications for Cou
- Page 6 and 7:
March 5, 2012 (Work Session)PageThe
- Page 8 and 9:
March 5, 2012 (Work Session)PageMcA
- Page 11 and 12:
March 5, 2012 (Work Session)PageMik
- Page 13 and 14:
March 19, 2012 (Regular Meeting)Pag
- Page 16 and 17:
March 19, 2012 (Regular Meeting)Pag
- Page 18:
March 19, 2012 (Regular Meeting)Pag
- Page 21 and 22:
March 19, 2012 (Regular Meeting)Pag
- Page 23 and 24:
March 19, 2012 (Regular Meeting)Pag
- Page 25 and 26:
March 19, 2012 (Regular Meeting)Pag
- Page 27 and 28:
March 19, 2012 (Regular Meeting)Pag
- Page 29 and 30:
March 30, 2012 (Recessed Meeting)Pa
- Page 31 and 32:
NoCOUNTY MANAGER'S RECOMMENDATIONS/
- Page 33 and 34:
ATTACHMENTSProclamationC-2Page 33
- Page 35 and 36:
CABARRUS COUNTYBOARD OF COMMISSIONE
- Page 37 and 38:
CABARRUS COUNTYBOARD OF COMMISSIONE
- Page 39 and 40:
CABARRUS COUNTYBOARD OF COMMISSIONE
- Page 41 and 42:
CABARRUS COUNTYBOARD OF COMMISSIONE
- Page 43 and 44:
Soil & Water Stewardship Week2012P
- Page 45 and 46:
SEXUAL ASSAULT AWARENESS MONTHPROCL
- Page 47 and 48:
NATIONAL TRAVEL AND TOURISM WEEK PR
- Page 49 and 50:
ATTACHMENTSWeatherization Applicati
- Page 51 and 52:
NCWAP03/12_________________________
- Page 53 and 54:
NCWAP03/12information year round al
- Page 55 and 56:
CABARRUS COUNTYBOARD OF COMMISSIONE
- Page 57 and 58:
Drawn by and Mail to:Richard M. Koc
- Page 59 and 60:
Section 3.02 Failure to Perform Obl
- Page 61 and 62:
CABARRUS COUNTYBOARD OF COMMISSIONE
- Page 63 and 64:
Attachment number 1F-3Page 63
- Page 65 and 66:
CABARRUS COUNTYBOARD OF COMMISSIONE
- Page 67 and 68:
Attachment number 1F-4Page 67
- Page 69 and 70:
CABARRUS COUNTYBOARD OF COMMISSIONE
- Page 71:
CABARRUS COUNTYBOARD OF COMMISSIONE
- Page 75 and 76:
IV. Direct Purchases……………
- Page 77 and 78:
Article 1GENERAL INFORMATIONI. PURP
- Page 79 and 80:
Expenditure commitments created by
- Page 81 and 82:
A written or electronic request fro
- Page 83 and 84:
Purchasing and the County departmen
- Page 85 and 86:
8. Advise the Purchasing Agent of t
- Page 87 and 88:
IV.GIFTS AND FAVORSNCGS § 133-32 m
- Page 89 and 90:
Article 5METHODS OF PROCUREMENTThe
- Page 91 and 92:
intended. Specifications are prepar
- Page 93 and 94:
c. RFPs shall be solicited from an
- Page 95 and 96:
entering into the contract to keep
- Page 97 and 98:
4. Notice of intent to award the co
- Page 99 and 100:
1. Contracts in excess of $90,000 m
- Page 101 and 102:
The purchase of used equipment is e
- Page 103 and 104:
2. A bid is “responsive” if it
- Page 105 and 106:
NCGS § 143-129 reserves the right
- Page 107 and 108:
Article 7PURCHASING SYSTEMSI. MUNIS
- Page 109 and 110:
Legal RequirementsSingle-prime and
- Page 111 and 112:
demonstrating recruitment and selec
- Page 113 and 114:
elated to a new building of substan
- Page 115 and 116:
Article 10CONTRACT ADMINISTRATIONCo
- Page 117 and 118:
D. Reimbursable ExpensesNormal Reim
- Page 119 and 120:
A legal document outlining the term
- Page 121 and 122:
CABARRUS COUNTYBOARD OF COMMISSIONE
- Page 123 and 124:
ELMA C. LOMAX FARMFee Schedule2012A
- Page 125 and 126:
Budgetary needs for the first year
- Page 127 and 128:
Cabarrus County Elma C Lomax Commun
- Page 129 and 130:
• Keep trash out of the plot, and
- Page 131 and 132:
CABARRUS COUNTYBOARD OF COMMISSIONE
- Page 133 and 134:
Summary of Releases and Refunds for
- Page 135 and 136:
BURGESS CHRISTOPHER ALAN 2011-63671
- Page 137 and 138:
JOHNSON SAMUEL EVANS 2011-617349 PR
- Page 139 and 140:
SANCHEZ JUAN CARLOS 2011-625819 ACT
- Page 141 and 142:
CABARRUS COUNTYBOARD OF COMMISSIONE
- Page 143 and 144:
Cabarrus County Economic Developmen
- Page 145 and 146:
ECONOMIC DEVELOPMENT GRANT PROGRAMC
- Page 147 and 148:
Such Grant amount shall be for a pe
- Page 149 and 150:
to the project's date of useful occ
- Page 151 and 152:
the estimated increase specified in
- Page 153 and 154:
construction and equipment installa
- Page 155 and 156:
a breach or default under the terms
- Page 157 and 158:
(h) Governing Law. This Agreement i
- Page 159 and 160:
Public Hearing NoticesPage 1 of 1Co
- Page 161 and 162:
CABARRUS COUNTYBOARD OF COMMISSIONE
- Page 163 and 164:
ME MORANDUMTo: Cabarrus CountyBoard
- Page 165 and 166:
2. Mitigation of the pro-rata share
- Page 167 and 168:
CABARRUS COUNTYBOARD OF COMMISSIONE
- Page 169 and 170:
Attachment number 1G-3Page 169
- Page 171 and 172:
Attachment number 2G-3Page 171
- Page 173 and 174:
Attachment number 2G-3Page 173
- Page 175 and 176:
Attachment number 2G-3Page 175
- Page 177 and 178:
Attachment number 2G-3Page 177
- Page 179 and 180:
Attachment number 2G-3Page 179
- Page 181 and 182:
Attachment number 2G-3Page 181
- Page 183 and 184:
Attachment number 2G-3Page 183
- Page 185 and 186:
Attachment number 2G-3Page 185
- Page 187 and 188:
Attachment number 2G-3Page 187
- Page 189 and 190:
Attachment number 2G-3Page 189
- Page 191 and 192:
Attachment number 2G-3Page 191
- Page 193 and 194:
Attachment number 2G-3Page 193
- Page 195 and 196:
Attachment number 2G-3Page 195
- Page 197 and 198:
Attachment number 2G-3Page 197
- Page 199 and 200:
Attachment number 2G-3Page 199
- Page 201 and 202:
Attachment number 3G-3Page 201
- Page 203 and 204:
Attachment number 3G-3Page 203
- Page 205 and 206:
Attachment number 3G-3Page 205
- Page 207 and 208:
Attachment number 3G-3Page 207
- Page 209 and 210:
Attachment number 3G-3Page 209
- Page 211 and 212:
Attachment number 3G-3Page 211
- Page 213 and 214:
Attachment number 3G-3Page 213
- Page 215 and 216:
Attachment number 3G-3Page 215
- Page 217 and 218:
Attachment number 3G-3Page 217
- Page 219 and 220:
Attachment number 3G-3Page 219
- Page 221 and 222:
Attachment number 3G-3Page 221
- Page 223 and 224: Attachment number 3G-3Page 223
- Page 225 and 226: Attachment number 3G-3Page 225
- Page 227 and 228: CABARRUS COUNTYBOARD OF COMMISSIONE
- Page 229 and 230: NURSING HOME COMMUNITY ADVISORY COM
- Page 231 and 232: ADDITIONCABARRUS COUNTYBOARD OF COM
- Page 233 and 234: Cabarrus County Youth Council18 Mem
- Page 235 and 236: Cabarrus County Youth CouncilApplic
- Page 237 and 238: ATTACHMENTS2011 End of Year Child V
- Page 239 and 240: protection issues identified were:
- Page 241 and 242: The hours of operation listed on th
- Page 243 and 244: CABARRUS COUNTYBOARD OF COMMISSIONE
- Page 245 and 246: CABARRUS COUNTYBOARD OF COMMISSIONE
- Page 247 and 248: CABARRUS COUNTYBOARDS, COMMITTEES,
- Page 249 and 250: INDUSTRIAL FACILITIES AND POLLUTION
- Page 251 and 252: V-8 STMAY STDAKOTA STS RIDGE AVECON
- Page 253 and 254: Office Use OnlyDATE RECEIVED:Applic
- Page 255 and 256: 4/2012I-3Page 255
- Page 257 and 258: ADDITIONCABARRUS COUNTYBOARD OF COM
- Page 259 and 260: NORTH CAROLINA ECONOMIC OVERVIEW: F
- Page 261 and 262: Housing indicators continue to impr
- Page 263 and 264: Staff ActivitiesJanuary 1 - March 3
- Page 265 and 266: 3.14 Meeting with corporate legal c
- Page 267 and 268: 2.28 EDC Board meeting2.29 Partner
- Page 269 and 270: 3.8 Webinar: Mobile trends3.9 Lunch
- Page 271 and 272: Missions, Convention ReportJanuary
- Page 273: I-4Page 273
- Page 277 and 278: Source: Department of the Secretary
- Page 279 and 280: I-4Page 279
- Page 281 and 282: Table of ContentsIntroduction …
- Page 283 and 284: this report is only a snapshot of w
- Page 285 and 286: Manufacturing constituted 37.7% of
- Page 287 and 288: SoftSkillsGaps60Communication/Inter
- Page 289 and 290: TrainingResourcesUsed80InHouseTrain
- Page 291 and 292: MethodsUsedforRecruiting80WordofMou
- Page 293 and 294: MeasurestoAddressSkillNeeds70605040
- Page 295 and 296: V. ConclusionAn adequate supply of
- Page 297 and 298: Gina RogersBusiness Services Repres
- Page 299 and 300: Details on Response to Question Num
- Page 301 and 302: Our Investors:I-4Page 301
- Page 303: ADDITIONCABARRUS COUNTYBOARD OF COM