Download pdf guide - VSN International
Download pdf guide - VSN International
Download pdf guide - VSN International
- No tags were found...
Create successful ePaper yourself
Turn your PDF publications into a flip-book with our unique Google optimized e-Paper software.
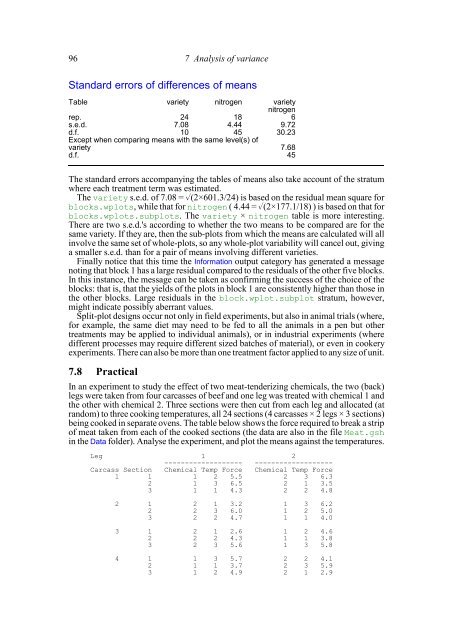
96 7 Analysis of varianceStandard errors of differences of meansTable variety nitrogen varietynitrogenrep. 24 18 6s.e.d. 7.08 4.44 9.72d.f. 10 45 30.23Except when comparing means with the same level(s) ofvariety 7.68d.f. 45The standard errors accompanying the tables of means also take account of the stratumwhere each treatment term was estimated.The variety s.e.d. of 7.08 = (2×601.3/24) is based on the residual mean square forblocks.wplots, while that for nitrogen ( 4.44 = (2×177.1/18) ) is based on that forblocks.wplots.subplots. The variety × nitrogen table is more interesting.There are two s.e.d.'s according to whether the two means to be compared are for thesame variety. If they are, then the sub-plots from which the means are calculated will allinvolve the same set of whole-plots, so any whole-plot variability will cancel out, givinga smaller s.e.d. than for a pair of means involving different varieties.Finally notice that this time the Information output category has generated a messagenoting that block 1 has a large residual compared to the residuals of the other five blocks.In this instance, the message can be taken as confirming the success of the choice of theblocks: that is, that the yields of the plots in block 1 are consistently higher than those inthe other blocks. Large residuals in the block.wplot.subplot stratum, however,might indicate possibly aberrant values.Split-plot designs occur not only in field experiments, but also in animal trials (where,for example, the same diet may need to be fed to all the animals in a pen but othertreatments may be applied to individual animals), or in industrial experiments (wheredifferent processes may require different sized batches of material), or even in cookeryexperiments. There can also be more than one treatment factor applied to any size of unit.7.8 PracticalIn an experiment to study the effect of two meat-tenderizing chemicals, the two (back)legs were taken from four carcasses of beef and one leg was treated with chemical 1 andthe other with chemical 2. Three sections were then cut from each leg and allocated (atrandom) to three cooking temperatures, all 24 sections (4 carcasses × 2 legs × 3 sections)being cooked in separate ovens. The table below shows the force required to break a stripof meat taken from each of the cooked sections (the data are also in the file Meat.gshin the Data folder). Analyse the experiment, and plot the means against the temperatures.Leg 1 2------------------- -------------------Carcass Section Chemical Temp Force Chemical Temp Force1 1 1 2 5.5 2 3 6.32 1 3 6.5 2 1 3.53 1 1 4.3 2 2 4.82 1 2 1 3.2 1 3 6.22 2 3 6.0 1 2 5.03 2 2 4.7 1 1 4.03 1 2 1 2.6 1 2 4.62 2 2 4.3 1 1 3.83 2 3 5.6 1 3 5.84 1 1 3 5.7 2 2 4.12 1 1 3.7 2 3 5.93 1 2 4.9 2 1 2.9


