Download pdf guide - VSN International
Download pdf guide - VSN International
Download pdf guide - VSN International
- No tags were found...
Create successful ePaper yourself
Turn your PDF publications into a flip-book with our unique Google optimized e-Paper software.
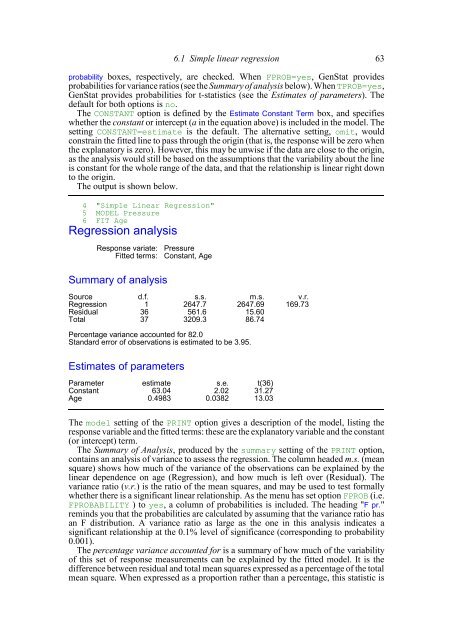
6.1 Simple linear regression 63probability boxes, respectively, are checked. When FPROB=yes, GenStat providesprobabilities for variance ratios (see the Summary of analysis below). When TPROB=yes,GenStat provides probabilities for t-statistics (see the Estimates of parameters). Thedefault for both options is no.The CONSTANT option is defined by the Estimate Constant Term box, and specifieswhether the constant or intercept (a in the equation above) is included in the model. Thesetting CONSTANT=estimate is the default. The alternative setting, omit, wouldconstrain the fitted line to pass through the origin (that is, the response will be zero whenthe explanatory is zero). However, this may be unwise if the data are close to the origin,as the analysis would still be based on the assumptions that the variability about the lineis constant for the whole range of the data, and that the relationship is linear right downto the origin.The output is shown below.4 "Simple Linear Regression"5 MODEL Pressure6 FIT AgeRegression analysisResponse variate: PressureFitted terms: Constant, AgeSummary of analysisSource d.f. s.s. m.s. v.r.Regression 1 2647.7 2647.69 169.73ResidualTotal3637561.63209.315.6086.74Percentage variance accounted for 82.0Standard error of observations is estimated to be 3.95.Estimates of parametersParameter estimate s.e. t(36)Constant 63.04 2.02 31.27Age 0.4983 0.0382 13.03The model setting of the PRINT option gives a description of the model, listing theresponse variable and the fitted terms: these are the explanatory variable and the constant(or intercept) term.The Summary of Analysis, produced by the summary setting of the PRINT option,contains an analysis of variance to assess the regression. The column headed m.s. (meansquare) shows how much of the variance of the observations can be explained by thelinear dependence on age (Regression), and how much is left over (Residual). Thevariance ratio (v.r.) is the ratio of the mean squares, and may be used to test formallywhether there is a significant linear relationship. As the menu has set option FPROB (i.e.FPROBABILITY ) to yes, a column of probabilities is included. The heading "F pr."reminds you that the probabilities are calculated by assuming that the variance ratio hasan F distribution. A variance ratio as large as the one in this analysis indicates asignificant relationship at the 0.1% level of significance (corresponding to probability0.001).The percentage variance accounted for is a summary of how much of the variabilityof this set of response measurements can be explained by the fitted model. It is thedifference between residual and total mean squares expressed as a percentage of the totalmean square. When expressed as a proportion rather than a percentage, this statistic is


