84 7 Analysis of varianceterms for the analysis. Again its parameter is a model formula (usually called thetreatment formula), and it has no options.A full definition of model formulae is given in Section 3.9, so we give only a briefdescription here. In its simplest form, a model formula is a list of model terms separatedby the operator +. Each model term specifies a set of parameters in a statistical model.It may be a single factor (representing a set of main effects). Alternatively, it may consistof several factors separated by the operator dot (.), and define a higher-order term likean interaction. The other operators provide ways of specifying a formula more succinctly,or of representing its structure more clearly.Factorial (or crossed) relationships can be specified by the star operator (*). Here wehave a two-way factorial structure and so, in line 3 below, we defineTREATMENTSTRUCTURE N * SThis is expanded by GenStat automatically to becomeTREATMENTSTRUCTURE N + S + N.SThe meanings of terms like N.S depend on context: they represent all the joint effects ofthe factors in the term that have not been fitted already by earlier terms in the model.Here we have fitted the main effects of N and S, and so N.S represents their interaction.The ANOVA directive has an option, FACTORIAL, which can be used to specify themaximum order (that is, number of factors) in the treatment terms to be fitted in theanalysis. The default is 3, so it does not need to be set in the script above.The COVARIATE directive specifies the covariates if an analysis of covariance isrequired. This is not discussed here, but details can be found in Section 3.6 of the Guideto Anova and Design in GenStat or Section 4.3 of the Guide to the GenStat CommandLanguage, Part 2 Statistics. Here there are no covariates. So the Covariates box in themenu has been left unchecked, and the script contains a null COVARIATE statement tocancel any earlier definition.Once the model has been defined, the ANOVA directive can be used to perform theanalysis of variance. Its first parameter specifies the response or y-variates. The menuallows you to analyse only one variate at a time, but the command allows you to listseveral. If a y-variate contains missing values, these are estimated in the analysis and thedegrees of freedom are adjusted (see the Guide to the GenStat Command Language, Part2 Statistics, Section 4.4). When you list several y-variates, a unit will be treated asmissing if it missing in any y-variate or any covariate. So, if the y-variates have differentsets of missing units, you may prefer to analyse them in separate statements.The options of the ANOVAstatement are defined by boxes inthe ANOVA Options menu (Figure7.3), which is obtained by clickingon the Options button of the Analysisof Variance menu. Most of theDisplay boxes are used to define thePRINT option of ANOVA; this can beset to a list of string tokens to selectthe output to be printed. Theexception is the F-probabilities box,which sets the option FPROB (i.e.FPROBABILITY); this controlswhether probabilities are given forthe variance ratios in the analysisof-variancetable.The most commonly used settingsof PRINT are:Figure 7.3
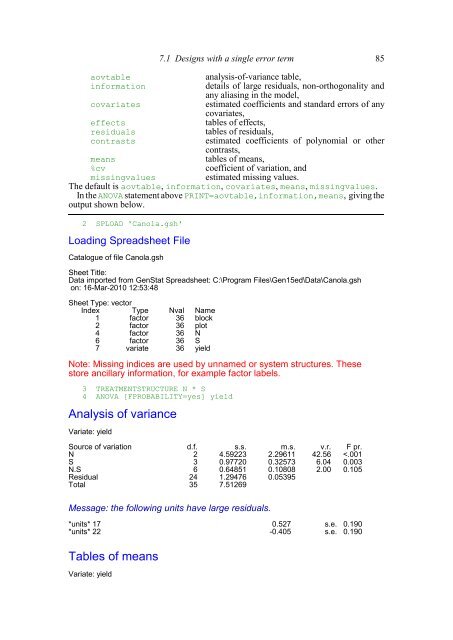
7.1 Designs with a single error term 85aovtableanalysis-of-variance table,informationdetails of large residuals, non-orthogonality andany aliasing in the model,covariatesestimated coefficients and standard errors of anycovariates,effectstables of effects,residualstables of residuals,contrastsestimated coefficients of polynomial or othercontrasts,meanstables of means,%cvcoefficient of variation, andmissingvaluesestimated missing values.The default is aovtable, information, covariates, means, missingvalues.In the ANOVA statement above PRINT=aovtable,information,means, giving theoutput shown below.2 SPLOAD 'Canola.gsh'Loading Spreadsheet FileCatalogue of file Canola.gshSheet Title:Data imported from GenStat Spreadsheet: C:\Program Files\Gen15ed\Data\Canola.gshon: 16-Mar-2010 12:53:48Sheet Type: vectorIndex1TypefactorNval Name36 block2 factor 36 plot4 factor 36 N6 factor 36 S7 variate 36 yieldNote: Missing indices are used by unnamed or system structures. Thesestore ancillary information, for example factor labels.3 TREATMENTSTRUCTURE N * S4 ANOVA [FPROBABILITY=yes] yieldAnalysis of varianceVariate: yieldSource of variation d.f. s.s. m.s. v.r. F pr.N 2 4.59223 2.29611 42.56