

Download pdf guide - VSN International
Download pdf guide - VSN International
Download pdf guide - VSN International
- No tags were found...

You also want an ePaper? Increase the reach of your titles
YUMPU automatically turns print PDFs into web optimized ePapers that Google loves.
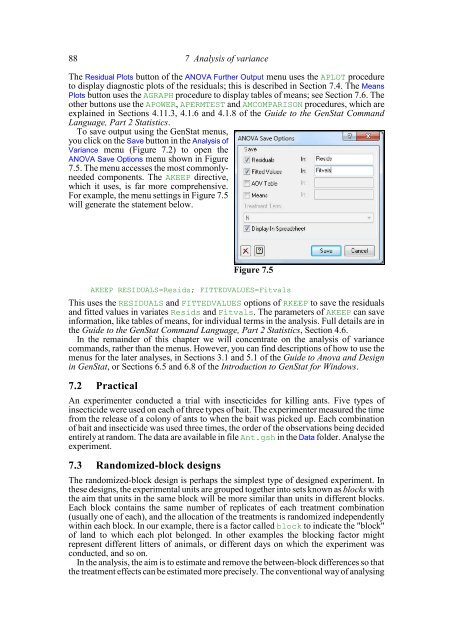
88 7 Analysis of varianceThe Residual Plots button of the ANOVA Further Output menu uses the APLOT procedureto display diagnostic plots of the residuals; this is described in Section 7.4. The MeansPlots button uses the AGRAPH procedure to display tables of means; see Section 7.6. Theother buttons use the APOWER, APERMTEST and AMCOMPARISON procedures, which areexplained in Sections 4.11.3, 4.1.6 and 4.1.8 of the Guide to the GenStat CommandLanguage, Part 2 Statistics.To save output using the GenStat menus,you click on the Save button in the Analysis ofVariance menu (Figure 7.2) to open theANOVA Save Options menu shown in Figure7.5. The menu accesses the most commonlyneededcomponents. The AKEEP directive,which it uses, is far more comprehensive.For example, the menu settings in Figure 7.5will generate the statement below.Figure 7.5AKEEP RESIDUALS=Resids; FITTEDVALUES=FitvalsThis uses the RESIDUALS and FITTEDVALUES options of RKEEP to save the residualsand fitted values in variates Resids and Fitvals. The parameters of AKEEP can saveinformation, like tables of means, for individual terms in the analysis. Full details are inthe Guide to the GenStat Command Language, Part 2 Statistics, Section 4.6.In the remainder of this chapter we will concentrate on the analysis of variancecommands, rather than the menus. However, you can find descriptions of how to use themenus for the later analyses, in Sections 3.1 and 5.1 of the Guide to Anova and Designin GenStat, or Sections 6.5 and 6.8 of the Introduction to GenStat for Windows.7.2 PracticalAn experimenter conducted a trial with insecticides for killing ants. Five types ofinsecticide were used on each of three types of bait. The experimenter measured the timefrom the release of a colony of ants to when the bait was picked up. Each combinationof bait and insecticide was used three times, the order of the observations being decidedentirely at random. The data are available in file Ant.gsh in the Data folder. Analyse theexperiment.7.3 Randomized-block designsThe randomized-block design is perhaps the simplest type of designed experiment. Inthese designs, the experimental units are grouped together into sets known as blocks withthe aim that units in the same block will be more similar than units in different blocks.Each block contains the same number of replicates of each treatment combination(usually one of each), and the allocation of the treatments is randomized independentlywithin each block. In our example, there is a factor called block to indicate the "block"of land to which each plot belonged. In other examples the blocking factor mightrepresent different litters of animals, or different days on which the experiment wasconducted, and so on.In the analysis, the aim is to estimate and remove the between-block differences so thatthe treatment effects can be estimated more precisely. The conventional way of analysing


