

Download pdf guide - VSN International
Download pdf guide - VSN International
Download pdf guide - VSN International
- No tags were found...

Create successful ePaper yourself
Turn your PDF publications into a flip-book with our unique Google optimized e-Paper software.
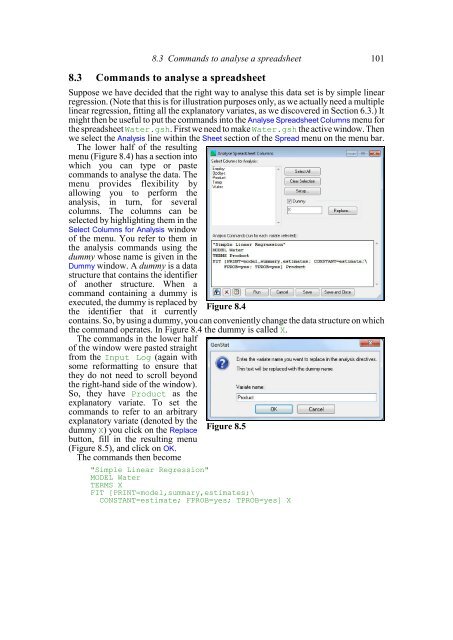
8.3 Commands to analyse a spreadsheet 1018.3 Commands to analyse a spreadsheetSuppose we have decided that the right way to analyse this data set is by simple linearregression. (Note that this is for illustration purposes only, as we actually need a multiplelinear regression, fitting all the explanatory variates, as we discovered in Section 6.3.) Itmight then be useful to put the commands into the Analyse Spreadsheet Columns menu forthe spreadsheet Water.gsh. First we need to make Water.gsh the active window. Thenwe select the Analysis line within the Sheet section of the Spread menu on the menu bar.The lower half of the resultingmenu (Figure 8.4) has a section intowhich you can type or pastecommands to analyse the data. Themenu provides flexibility byallowing you to perform theanalysis, in turn, for severalcolumns. The columns can beselected by highlighting them in theSelect Columns for Analysis windowof the menu. You refer to them inthe analysis commands using thedummy whose name is given in theDummy window. A dummy is a datastructure that contains the identifierof another structure. When acommand containing a dummy isexecuted, the dummy is replaced bythe identifier that it currentlyFigure 8.4contains. So, by using a dummy, you can conveniently change the data structure on whichthe command operates. In Figure 8.4 the dummy is called X.The commands in the lower halfof the window were pasted straightfrom the Input Log (again withsome reformatting to ensure thatthey do not need to scroll beyondthe right-hand side of the window).So, they have Product as theexplanatory variate. To set thecommands to refer to an arbitraryexplanatory variate (denoted by thedummy X) you click on the Replacebutton, fill in the resulting menu(Figure 8.5), and click on OK.The commands then becomeFigure 8.5"Simple Linear Regression"MODEL WaterTERMS XFIT [PRINT=model,summary,estimates;\CONSTANT=estimate; FPROB=yes; TPROB=yes] X


