

Download pdf guide - VSN International
Download pdf guide - VSN International
Download pdf guide - VSN International
- No tags were found...

Create successful ePaper yourself
Turn your PDF publications into a flip-book with our unique Google optimized e-Paper software.
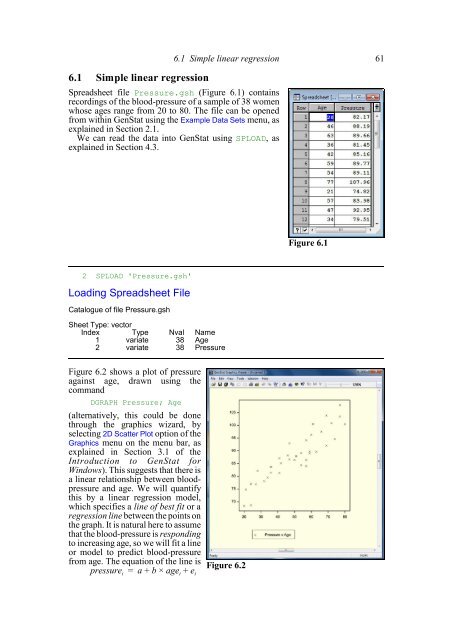
6.1 Simple linear regression6.1 Simple linear regression 61Spreadsheet file Pressure.gsh (Figure 6.1) containsrecordings of the blood-pressure of a sample of 38 womenwhose ages range from 20 to 80. The file can be openedfrom within GenStat using the Example Data Sets menu, asexplained in Section 2.1.We can read the data into GenStat using SPLOAD, asexplained in Section 4.3.Figure 6.12 SPLOAD 'Pressure.gsh'Loading Spreadsheet FileCatalogue of file Pressure.gshSheet Type: vectorIndex Type Nval Name1 variate 38 Age2 variate 38 PressureFigure 6.2 shows a plot of pressureagainst age, drawn using thecommandDGRAPH Pressure; Age(alternatively, this could be donethrough the graphics wizard, byselecting 2D Scatter Plot option of theGraphics menu on the menu bar, asexplained in Section 3.1 of theIntroduction to GenStat forWindows). This suggests that there isa linear relationship between bloodpressureand age. We will quantifythis by a linear regression model,which specifies a line of best fit or aregression line between the points onthe graph. It is natural here to assumethat the blood-pressure is respondingto increasing age, so we will fit a lineor model to predict blood-pressurefrom age. The equation of the line ispressure = a + b × age + ei i iFigure 6.2


