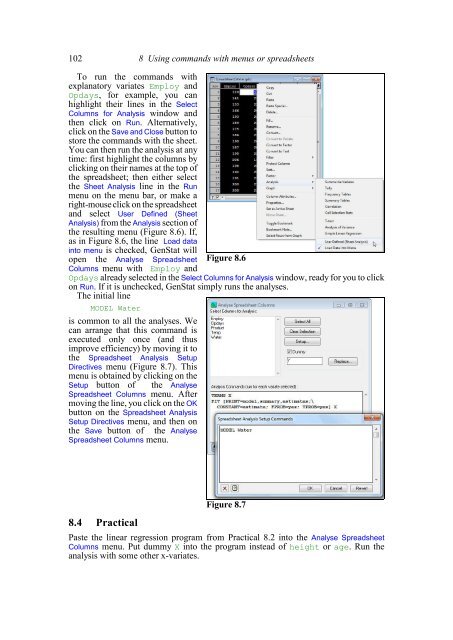
102 8 Using commands with menus or spreadsheetsTo run the commands withexplanatory variates Employ andOpdays, for example, you canhighlight their lines in the SelectColumns for Analysis window andthen click on Run. Alternatively,click on the Save and Close button tostore the commands with the sheet.You can then run the analysis at anytime: first highlight the columns byclicking on their names at the top ofthe spreadsheet; then either selectthe Sheet Analysis line in the Runmenu on the menu bar, or make aright-mouse click on the spreadsheetand select User Defined (SheetAnalysis) from the Analysis section ofthe resulting menu (Figure 8.6). If,as in Figure 8.6, the line Load datainto menu is checked, GenStat willopen the Analyse Spreadsheet Figure 8.6Columns menu with Employ andOpdays already selected in the Select Columns for Analysis window, ready for you to clickon Run. If it is unchecked, GenStat simply runs the analyses.The initial lineMODEL Wateris common to all the analyses. Wecan arrange that this command isexecuted only once (and thusimprove efficiency) by moving it tothe Spreadsheet AnalysisSetupDirectives menu (Figure 8.7). Thismenu is obtained by clicking on theSetup button of the AnalyseSpreadsheet Columns menu. Aftermoving the line, you click on the OKbutton on the Spreadsheet AnalysisSetup Directives menu, and then onthe Save button of the AnalyseSpreadsheet Columns menu.8.4 PracticalFigure 8.7Paste the linear regression program from Practical 8.2 into the Analyse SpreadsheetColumns menu. Put dummy X into the program instead of height or age. Run theanalysis with some other x-variates.
8.5 Repeating a sequence of commands 1038.5 Repeating a sequence of commands (FOR loops)The commands that are executed with the spreadsheet analysis commands for thecolumns Employ and Opdays can, as usual, be found in the Input Log."Analysis of Data in Spreadsheet: Water.gsh"MODEL WaterFOR X = Employ,Opdays"Simple Linear Regression"TERMS XFIT [PRINT=model,summary,estimates;\CONSTANT=estimate; FPROB=yes; TPROB=yes] XENDFORAfter the initial “setup” line to define Water as the dependant variate (and a commentto introduce the analysis), the TERMS and FIT lines are applied to the variates Employand Opdays using a for loop. This is introduced by a FOR directive, and terminated byan ENDFOR directive. The parameters of FOR take the form: dummy = list of identifiers.Here we have X = Employ,Opdays so the contents of the loop are executed twice. Onthe first time, X is set to Employ and on the second it is set to Opdays.If FOR has more than one parameter, the dummies change in parallel. So, if we had anadditional dependent variate, Coffee say, we could putFOR Y = Coffee,Water; X = Employ,OpdaysMODEL YTERMS XFIT [PRINT=model,summary,estimates;\CONSTANT=estimate; FPROB=yes; TPROB=yes] XENDFORto perform a regression for Coffee with explanatory variate Employ, and then one forWater with explanatory variate Opdays. So the two dummies, Y and X, pass throughtheir lists in parallel. If the second list, or any other subsequent list, is shorter than thefirst list it is “recycled”: that is, the dummy starts the list again each time it reaches theend until the first list has finished. For example,FOR Y = Coffee,Water,Biscuits; X = Employ,OpdaysMODEL YTERMS XFIT [PRINT=model,summary,estimates;\CONSTANT=estimate; FPROB=yes; TPROB=yes] XENDFORwould perform a regression for Coffee with explanatory variate Employ, then one forWater with explanatory variate Opdays, and finally one for Biscuits with explanatoryvariate Employ.Further information about FOR, and the other programming facilities that GenStatoffers, can be found in Chapter 9.8.6 PracticalModify the program that you wrote in the text window during Practical 8.2, and includea FOR loop to do regressions of• sbp on forearm,• weight on age, and• sbp on chin.Do you need to type sbp more than once? Run the program and examine the output.