

Download pdf guide - VSN International
Download pdf guide - VSN International
Download pdf guide - VSN International
- No tags were found...

Create successful ePaper yourself
Turn your PDF publications into a flip-book with our unique Google optimized e-Paper software.
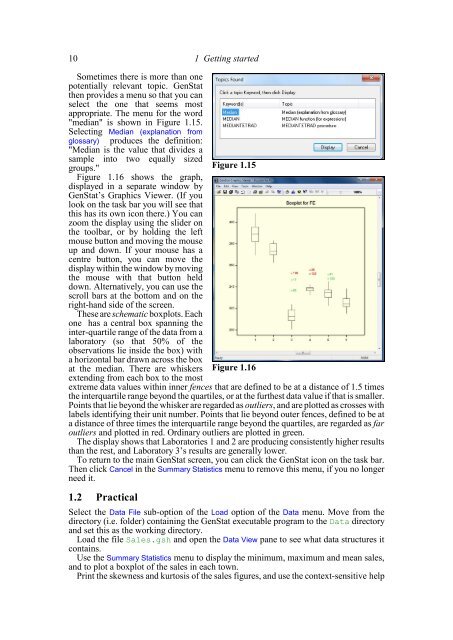
10 1 Getting startedSometimes there is more than onepotentially relevant topic. GenStatthen provides a menu so that you canselect the one that seems mostappropriate. The menu for the word"median" is shown in Figure 1.15.Selecting Median (explanation fromglossary)produces the definition:"Median is the value that divides asample into two equally sizedgroups."Figure 1.16 shows the graph,displayed in a separate window byGenStat’s Graphics Viewer. (If youlook on the task bar you will see thatthis has its own icon there.) You canzoom the display using the slider onthe toolbar, or by holding the leftmouse button and moving the mouseup and down. If your mouse has acentre button, you can move thedisplay within the window by movingthe mouse with that button helddown. Alternatively, you can use thescroll bars at the bottom and on theright-hand side of the screen.These are schematic boxplots. Eachone has a central box spanning theinter-quartile range of the data from alaboratory (so that 50% of theobservations lie inside the box) witha horizontal bar drawn across the boxat the median. There are whiskersextending from each box to the mostFigure 1.15Figure 1.16extreme data values within inner fences that are defined to be at a distance of 1.5 timesthe interquartile range beyond the quartiles, or at the furthest data value if that is smaller.Points that lie beyond the whisker are regarded as outliers, and are plotted as crosses withlabels identifying their unit number. Points that lie beyond outer fences, defined to be ata distance of three times the interquartile range beyond the quartiles, are regarded as faroutliers and plotted in red. Ordinary outliers are plotted in green.The display shows that Laboratories 1 and 2 are producing consistently higher resultsthan the rest, and Laboratory 3’s results are generally lower.To return to the main GenStat screen, you can click the GenStat icon on the task bar.Then click Cancel in the Summary Statistics menu to remove this menu, if you no longerneed it.1.2 PracticalSelect the Data File sub-option of the Load option of the Data menu. Move from thedirectory (i.e. folder) containing the GenStat executable program to the Data directoryand set this as the working directory.Load the file Sales.gsh and open the Data View pane to see what data structures itcontains.Use the Summary Statistics menu to display the minimum, maximum and mean sales,and to plot a boxplot of the sales in each town.Print the skewness and kurtosis of the sales figures, and use the context-sensitive help


